As you know, Facebook Ad’s built-in reporting may not be the best way to keep track of your campaign’s performance.
Optimize your ads and make more informed budget decisions by creating a Facebook Ads reporting dashboard where you can monitor campaigns at a high level and drill down to specific metrics. Data dashboards also give you the ability to:
- analyze the results you’re driving through customizable data visualizations
- bring together all the advertising metrics you track across Google Ads, Facebook Ads, and other ad networks into one place
- share with stakeholders your most effective campaigns without needing to mess with Facebook account roles and permissions
In this article, we’ll break down how to build the most effective Facebook Ads reporting dashboard including the metrics you can track to measure KPI’s such as reach, conversions, and ROI.
Table of Contents
How to Analyze Facebook Ads Campaign Performance With Dashboards
You can build out clear, actionable Facebook Ads reporting using a dashboard in three simple steps:
1. Define your audience and goals – The audience, in this case, is who will see your reporting whether it’s a client or co-worker. The type of campaigns you’re tracking will dictate what metrics are added to your Facebook Ads dashboard (more on that later).
2. Outline your reporting cadence – Are you needing a dashboard you can check daily? Do you need to send out weekly reports? Commit to a schedule and make sure your dashboard displays data to match. Cyfe lets you compare performance across date periods. You can also easily toggle between daily, weekly, and monthly views of your campaigns or set a custom date range.
3. Launch your dashboard – Easily connect your Facebook Ads data to your dashboard with a pre-built integration and launch your dashboard. Factor in these tips to create a dashboard and get the most out of it.
If you’re looking to get started using an existing template, you can also try our Facebook Ads dashboard for free.
Dashboards are also easy to share with different stakeholders — they don’t require a login to access. In Cyfe, share dashboards via a link or automated email. You can also add dashboards into internal sites and web apps using Cyfe’s embedded analytics.
The bottom line with Facebook Ads reporting: by building out a dashboard with a clean design and data visualizations, you can make your campaign results clear to others.
How to Measure the Success of a Facebook Ads Campaign
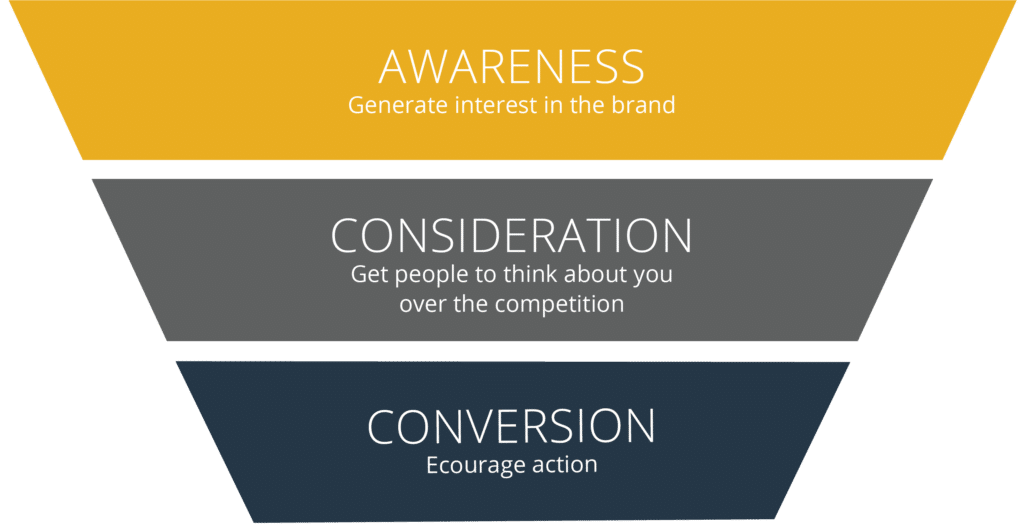
The metrics and KPIs included in your Facebook Ads campaign dashboard will depend on the funnel stage of your ads.
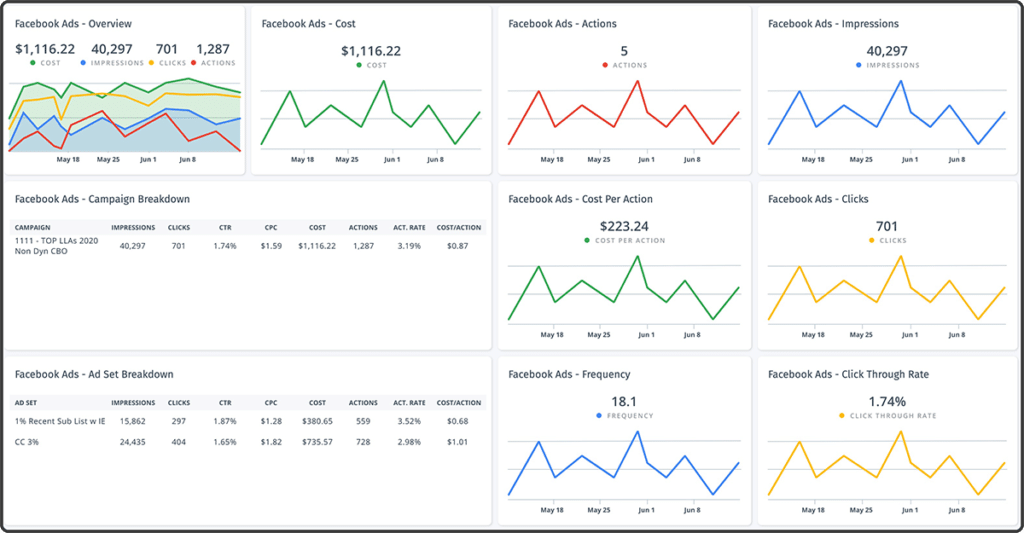
That said, Cyfe’s Facebook Ads reporting dashboard template includes the following metrics so you can tweak as you see fit:
| Metric | Description |
|---|---|
|
Impressions |
the total amount of times Facebook users saw your ad |
|
Clicks |
the number of times users click on links within your ad |
|
Click-Through Rate |
the percentage of users who saw your ad and clicked on its associated link |
|
Actions |
the total number of views, clicks, and conversions around your ad |
|
Cost Per Actions |
the total number of actions divided by the amount spent on your Facebook ad |
|
Frequency |
the average number of times Facebook users view your ad |
|
Overview |
show your ad costs, impressions, clicks, and actions in a single data visualization section |
Ultimately the KPIs you select will depend on your campaign goals. Let’s look at other metrics based on where leads are in your marketing funnel.
Facebook Ads Awareness Campaign Metrics
If you’re running brand awareness campaigns on Facebook, you’re likely prioritizing reach and any traffic increases you can attribute to your campaigns. Consider adding these metrics into your Facebook Ads reporting dashboard (in addition to any of the metrics mentioned above):
| Metric | Description |
|---|---|
|
Reach |
the number of unique users who saw your ad |
|
Cost Per Click |
the average cost for each link click |
|
Post Engagement |
the total number of actions that people take involving your ads |

If your awareness ads contain video, you’ll also want to monitor within your Facebook Ads Campaign dashboard:
| Metric | Description |
|---|---|
|
ThruPlays |
the number of times your video was played to completion, or for at least 15 seconds |
|
Video Watches at 25% |
The number of times users played your video to at least 25% of its length.This includes plays where a user skipped to the 25% point of the video. You can also track the video watches at 50%, 75%, and 100% in a Facebook Ads reporting dashboard |
|
Cost Per ThruPlay |
the average cost for each ThruPlay in a given Facebook Ads campaign |
Consideration Campaign Metrics
If you’re retargeting Facebook users and anyone else who has likely heard of your brand, you may be tracking these KPIs to drive further engagement:
| Metric | Description |
|---|---|
|
Action Types |
an overview of actions Facebook users take around your ad including post engagement, video views, and link clicks |
|
Unique Click-Through Rate |
The number of unique link clicks divided by the reach |
Conversion Campaign Metrics
For all your leads that complete an action, you now want to see how many conversions occurred. Facebook Ads reporting dashboards can track:
| Metric | Description |
|---|---|
|
Website Purchases ROAS |
the total return on ad spend (ROAS) from website purchases tracked by the Facebook pixel or Conversions API on your website |
|
Website Purchases Conversion Value |
the total value of event conversions tracked by the pixel on your website and attributed to your ads |
Once you’ve selected your metrics, you can customize the display of your dashboard. In Cyfe you can do this by selecting the chart type to show different data visualizations including line, columns, and stacked bar graphs. For example, if you want to see the video watches at different completion percentages, you may decide to use a bar graph.
Want to take it a step further? Launch a Google Analytics dashboard to keep track of all the referral traffic your site generates from Facebook Ads. That way, you can see how much Facebook Ads are moving the needle versus other marketing initiatives.
Summing Up Facebook Ads Reporting
By having your Facebook Ads metrics in one place together, you can see the clear winners driving results for your team. You can easily update your KPIs as you see fit and view the real-time results of any Facebook Ads campaigns with Cyfe’s dashboards. Share performance with your team, stakeholders, and organization.