How can we prove that our online marketing strategies are working?
Whether you’re tackling the performance of your website or building out a digital presence with clear goals for hundreds of clients, your web analytics can tell the story of what’s working, what needs attention, and where you should reevaluate.
Being able to monitor, track, and share your efforts on a well-designed web analytics dashboard can help elevate your business, client relationships, or internal company standing.
But with the ridiculous quantity of data sources, tools, and resources, where do you start?
Table of Contents
What is a web analytics dashboard?
A web analytics dashboard organizes and visualizes the most important data tied to your business goals and tracks the performance of those metrics over time.
By capturing the key performance indicators (KPIs) of your digital assets (your website, social accounts, advertising campaigns, etc.), you can shape a narrative that ensures your financial investments result in business growth.
Which web analytics are most important to your business?
Determining where to begin with your web analytics dashboard actually starts with your business goals. If you run an eCommerce business, you’re focusing primarily on product sales. If you’re a media publisher, you might be focused on website traffic and subscriptions. A local service business might be trying to book appointments.
- eCommerce – sales
- Publisher – ad buys, sponsors, subscriptions
- Local Service Business – appointments
- Non-profit organization – donations
- Marketing agency – clients
Understanding your primary business goal and how it relates to your digital marketing strategies will guide your analytics monitoring decisions. Once you have your primary, revenue-generating business goals identified, you should map out secondary goals that support the primary goal. This can be tied to your website, advertising campaigns, social media campaigns, email marketing campaigns, or other marketing strategies.
- Website traffic
- Calls/Driving directions
- Email/phone number captures
- Consultations
- Website forms filled
- Demos
- Social media followers/likes/engagement
- Email opens/clicks
- eBook downloads
By documenting your most important metrics, you can begin to understand how increases or decreases of those KPIs are tied to your marketing efforts.
Why do you need a web analytics dashboard to monitor your KPIs?
When you’re in charge of digital marketing and reporting on your performance to executives or clients, you need an easy way to share your data with the people that you’re working for.
A dashboard can solve a few different problems that you’ll run into when it comes to reporting:
- Tools don’t always have easily accessible reporting
- Not enough users provisioned for individual logins
- Asking stakeholders to log into a variety of tools
- Combining an expanse of data into one centralized location
- Tools require some expertise to understand the results
Your marketing and analytics don’t always play nice. Why send your boss 8 different reports on your website, email, social, advertising, when you can include it all on one real-time dashboard that they can access on their own terms?
Let’s look at how you can create an effective web analytics dashboard that will cut down the time you spend getting to your analytics, giving you more time to actually review your data.
Start with your website analytics
When you build out your web analytics dashboard, your primary goals are going to be accomplished on your website. For that reason, you’ll want to start with the two most universal (and free) options available: Google Analytics and Google Search Console.
The Essential Google Analytics Dashboard
Despite the fact that you can pull in your web analytics from many different data sources, if you’re just getting started and want to simplify KPI monitoring, you can settle on a pure Google Analytics Dashboard.
At Cyfe, we’ve actually made it even easier with a pre-built template that has the essential metrics that you’ll want to monitor.
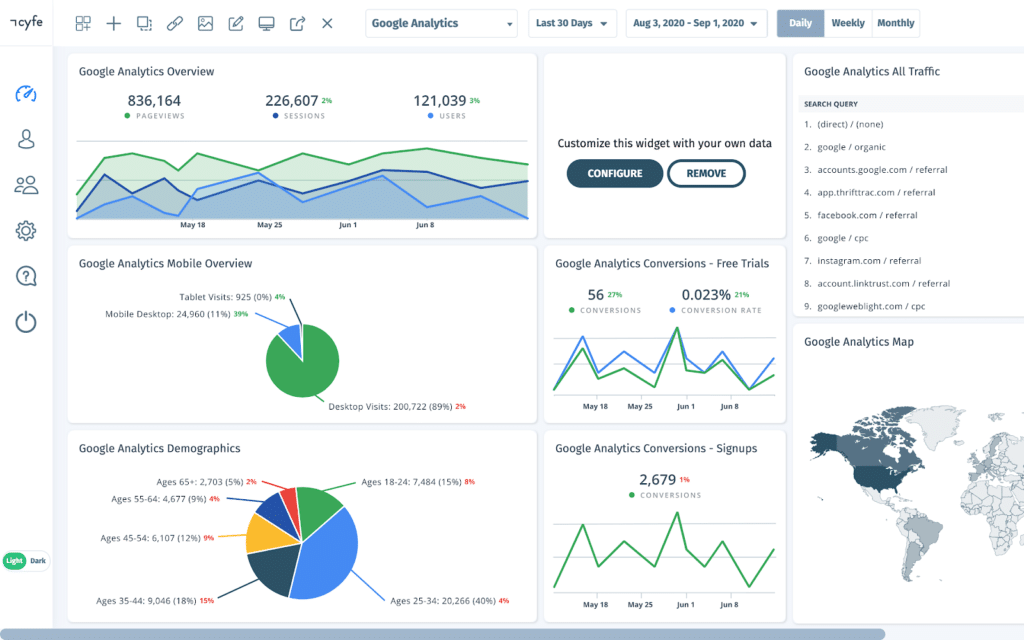
While Cyfe also has widgets for analytics from Chartbeat, GoSquared, and Mixpanel, we’ll continue to focus on Google Analytics since it’s the top choice in free web analytics tools.
There are over 100 Google Analytics widgets to choose from covering metrics for your Google Ads, apps, audience, content, conversions, commerce, and traffic sources.
Think about the areas in Google Analytics you visit the most.
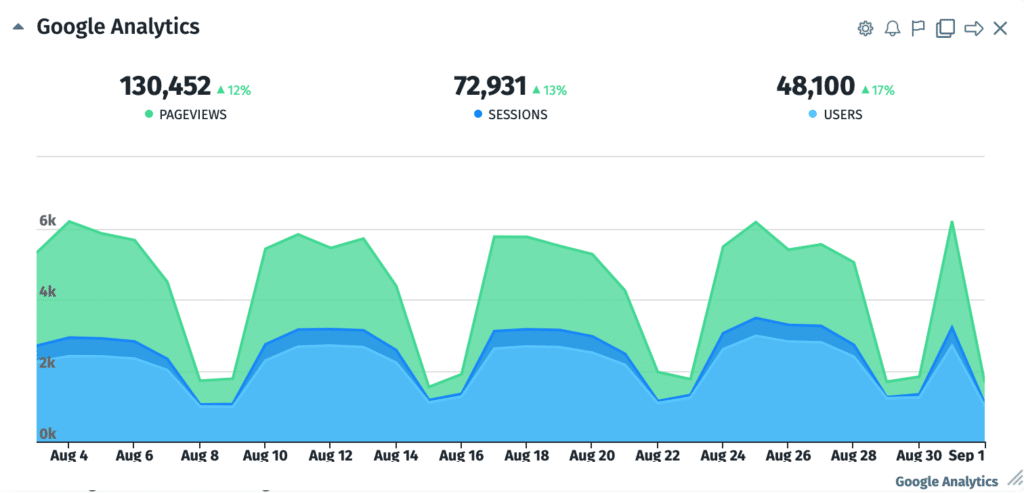
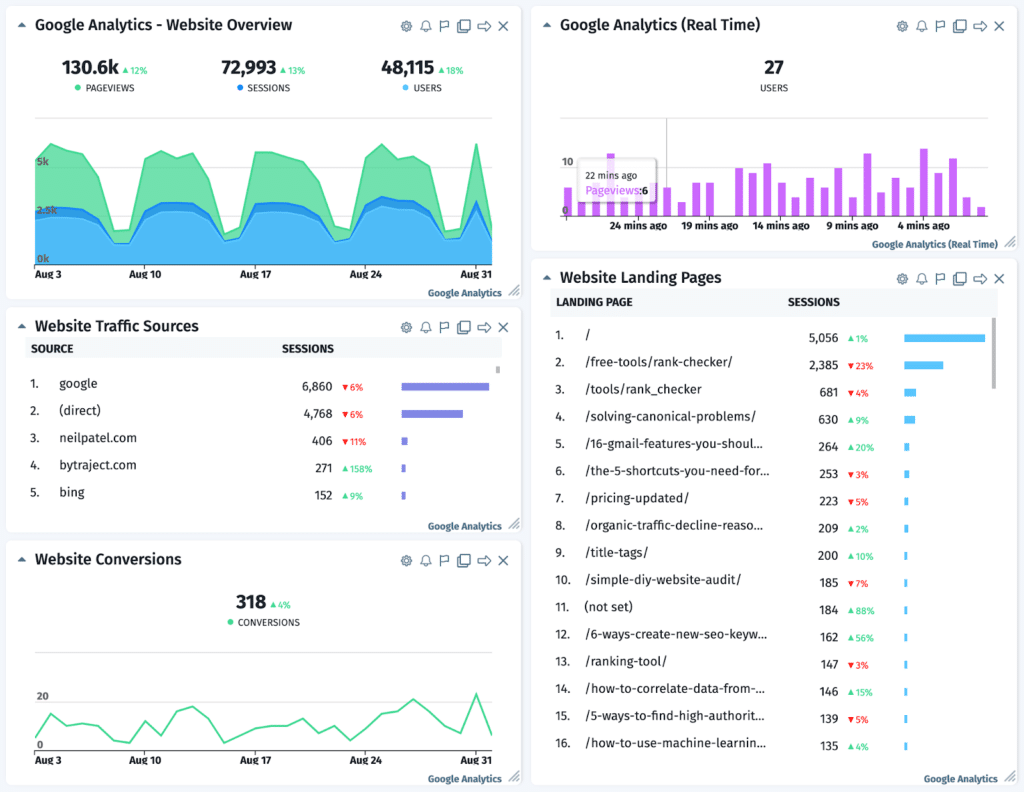
For example, your audience overview, which includes pageviews, sessions, and users.
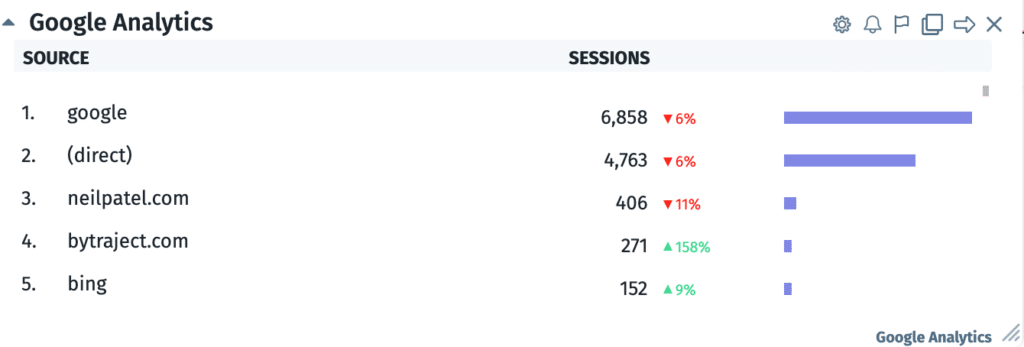
Top traffic sources and the corresponding sessions:
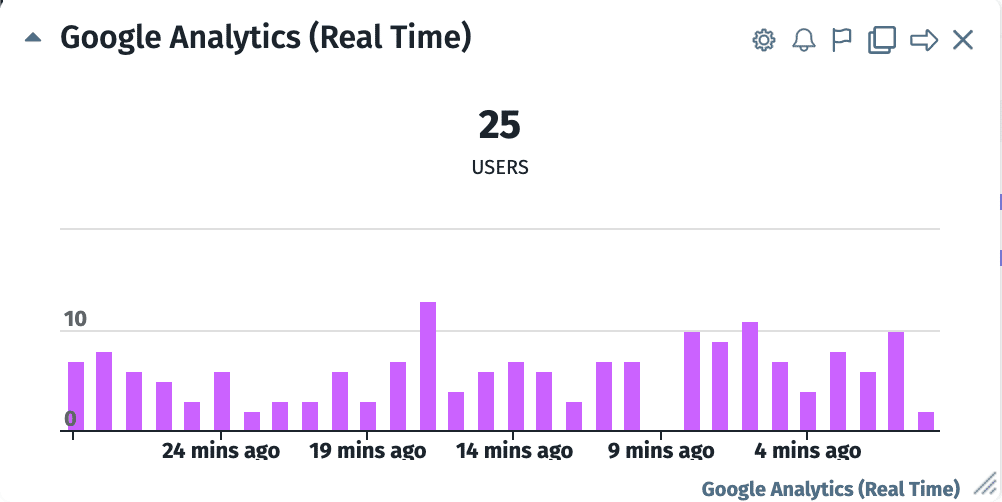
Real-time visitors to your website:
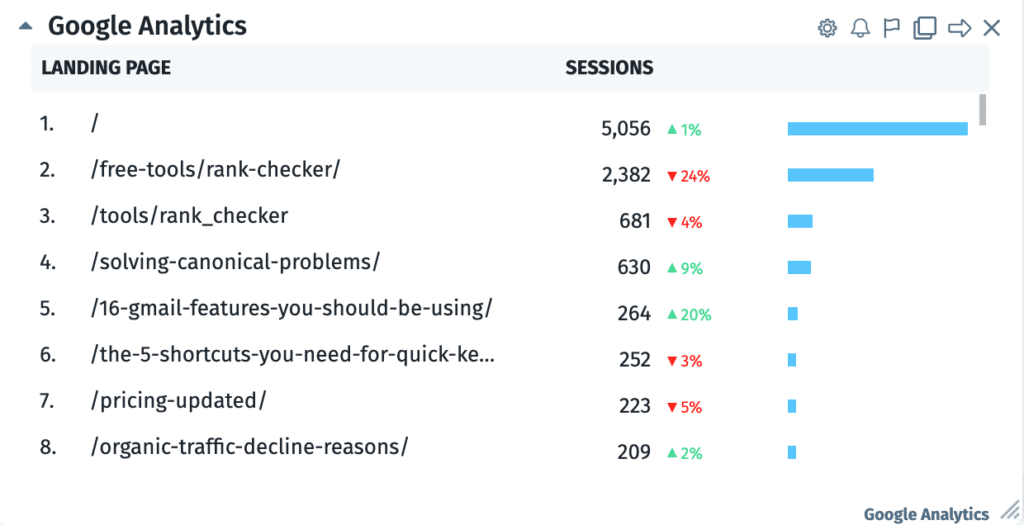
Top landing pages by URL that visitors are seeing first:
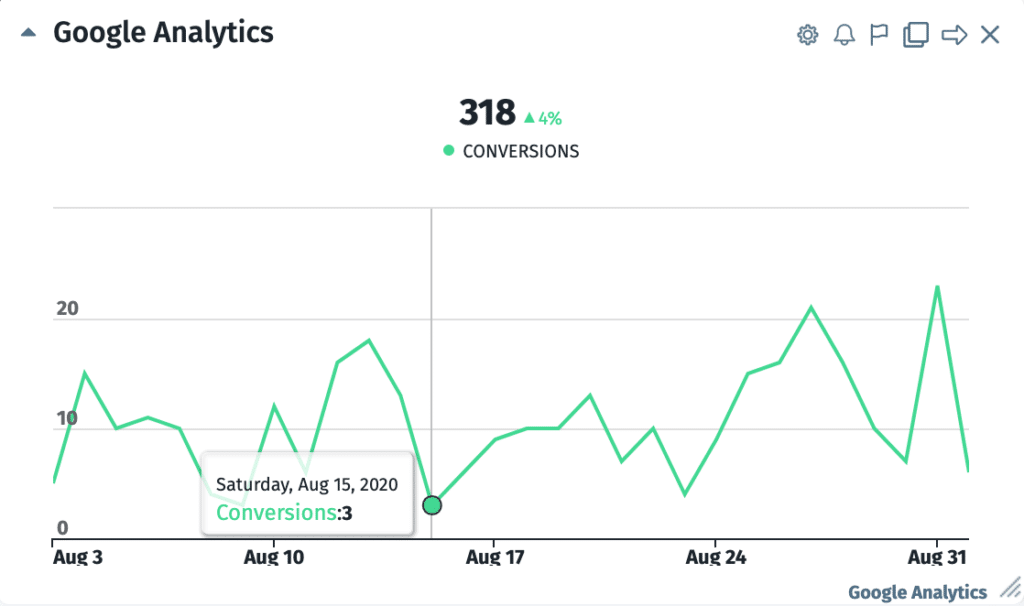
And, of course, your conversions. You can easily create multiple goals in Google Analytics and then track the conversion of any specific goal of your choice via the metrics selecting in the Google Analytics Cyfe widget.
As you can see, getting your favorite pieces of Google Analytics data for one website in one quick dashboard at a glance can be valuable in and of itself.
You can also create a dashboard that looks at important data from all of your websites at one glance.
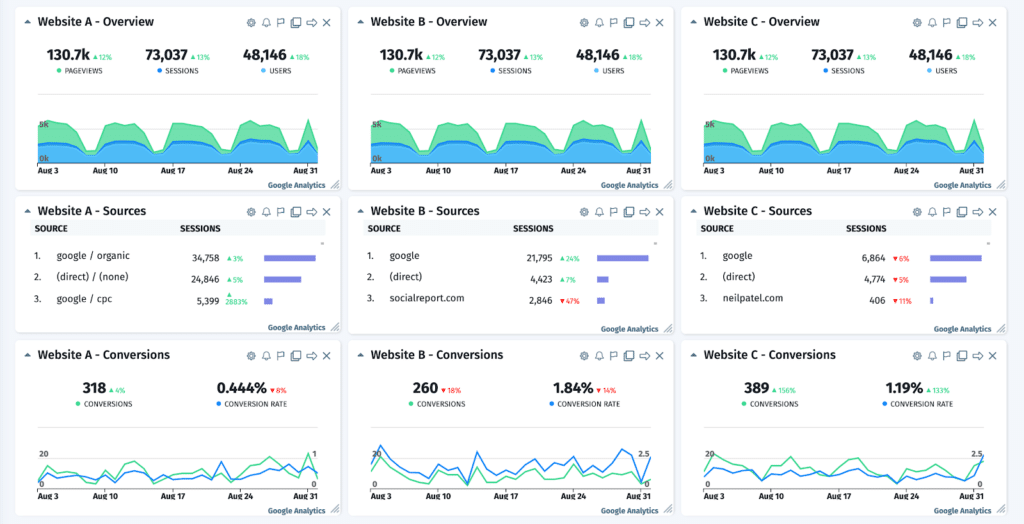
Being able to see performance across multiple domains is a game-changer for digital marketing agencies, multiple business owners, and larger holding companies. Since visualizing cross-domain tracking can be difficult via Google Analytics, you can use a Cyfe dashboard to bring those multiple website views together.
Now, let’s look beyond Google Analytics to other data you’ll want to keep track of for your websites.
Google Search Console Widgets
Serious marketers who want their websites to perform well in Google use Google Search Console, and for good reason. This is where you can get a peek into what Google thinks of your website. The overview widget will show you if you have unread messages, crawl errors, and the number of pages indexed from your site map along with the top internal and external keywords for your website.
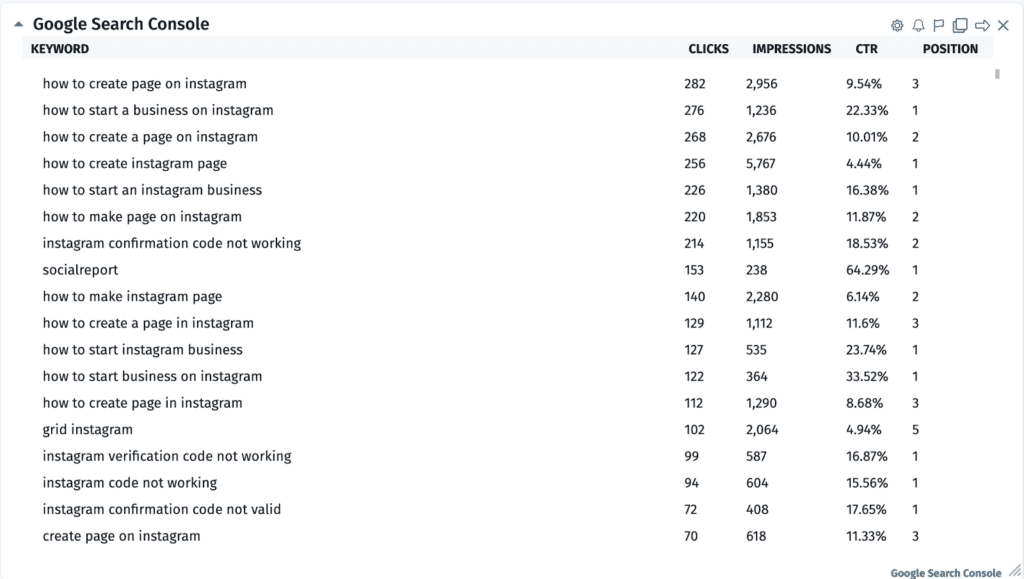
Put these widgets together for one or more websites in your analytics dashboard, and now you’ve brought two powerful Google tools into one place. But let’s not stop there…
Google My Business Widgets
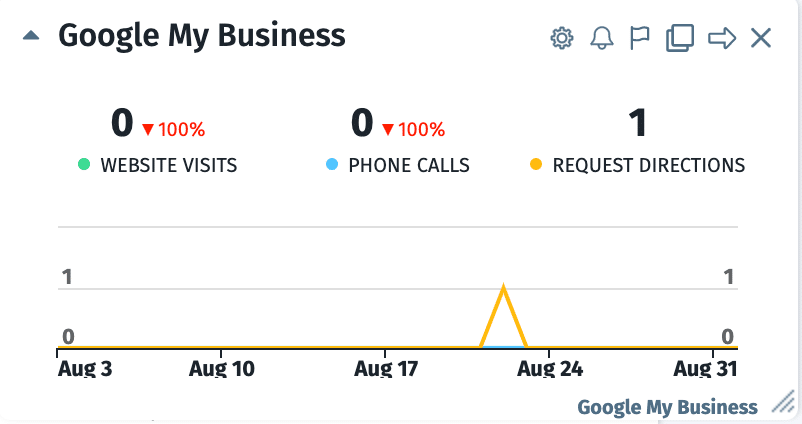
Running a local business or have multiple local business clients? You Google My Business metrics are going to tap into those primary goals that you’re always looking to improve. Through the Google My Business widget, you’re able to monitor your:
- Brand searches
- Google My Business views
- Actions
- Website visits
- Calls
- Driving Directions
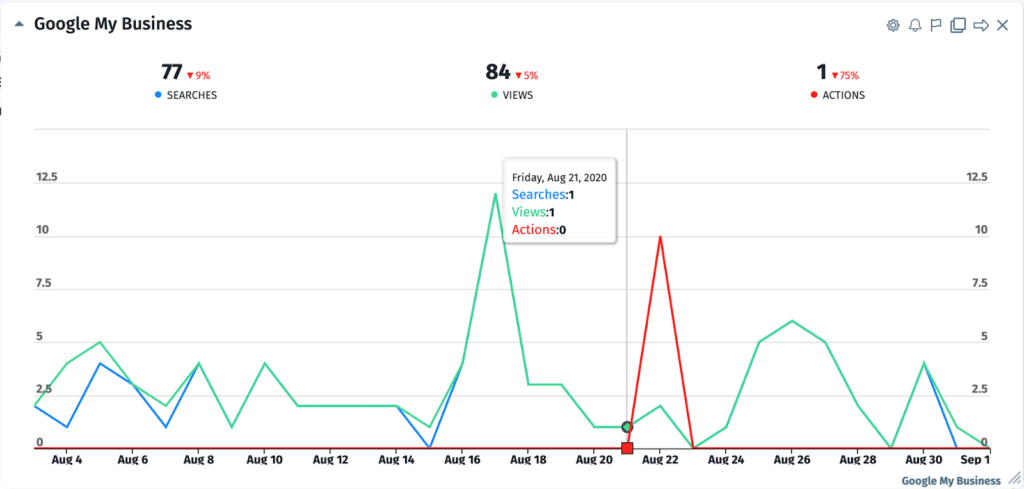
When you’re an agency running marketing for a local business, phone calls and requests for directions are some of the most important KPIs to share with your clients.
More Essential Web Analytics Widgets
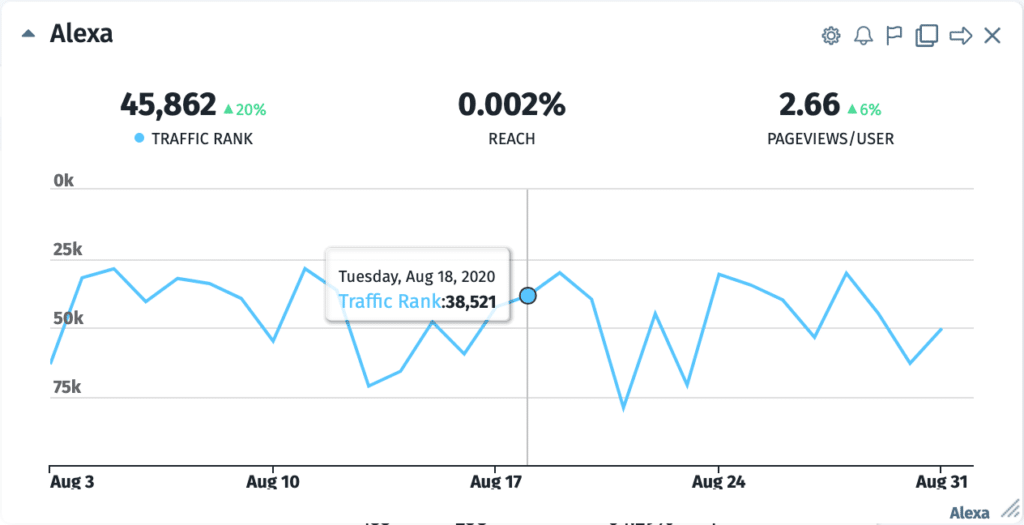
Want to know what other analytics tools think about your website? Why not add an Alexa widget to keep track of your traffic rank?
And a Pingdom widget to keep track of your website’s downtime.

Add these widgets for one or more websites into your dashboard for the ultimate overview of all of your website’s important analytics data.
Even More Analytics Widgets
If those weren’t enough for you, you can even start to mix in analytics from beyond your website. For example, you could line up your web analytics data next to widgets for the following.
- Google AdSense earnings, page views, clicks, CTR, CPC, and RPM.
- Google Ads cost, impressions, clicks, and conversions.
- Emails sent, bounces, unsubscribes, opens, and clicks from Aweber, Constant Contact, MailChimp, GetResponse, and other mailing list services.
- Google Alerts for mentions of your website or business.
- Online reviews from Google, Facebook, and 3rd Party review sites.
- Moz backlinks, external links, mozRank, domain authority, and page authority.
- Daily keyword rankings in SERPs.
- Analytics from Facebook, Twitter, Instagram, LinkedIn, or YouTube.
- Open support tickets from Zendesk.
The possibilities to monitor one or more websites are endless!
Get started building your own web analytics dashboard
As you can see, web analytics dashboards can help you cut down the mindless time spent logging into, navigating around, and browsing your web analytics data. This way, you can spend more time getting valuable insights to inform your digital marketing efforts, help your business grow, and move forward.


