“What’s measured improves,” said the great Peter Drucker. And it’s as simple as that.
Key metrics, also known as key performance indicators (KPIs), are integral to the success of your business. Tracking them is how you measure your company’s performance and gain insights that help you boost your bottom line.
In this article, discover the importance of measuring business metrics with five examples to put you on the right track.
Table of Contents
What are business metrics?
Business metrics are a measure of a business or department’s activities and tasks. They are often measured over a period of time: daily, weekly, monthly, quarterly, or yearly. You can track them to determine ideal performance.
The first and obvious thing: they tell you if you’ve achieved your business goals and, if you haven’t, what you need to work on to improve. But there’s more to it than that.
Tracking business metrics serve a cultural purpose. They give each department a reason to work hard, collaborate and share in each other’s victories. This generates a culture of success where everyone feels like they are having a positive impact on the business. In this end, this leads to enhanced profitability: a satisfied employee is a satisfied customer.

Why tracking business metrics is important
Your business isn’t one dimensional – getting an accurate picture on what’s really going on means measuring multiple metrics and observing how they affect each other. So you can understand exactly what is and isn’t contributing to success. Otherwise, you may make poor decisions that undermine your performance.
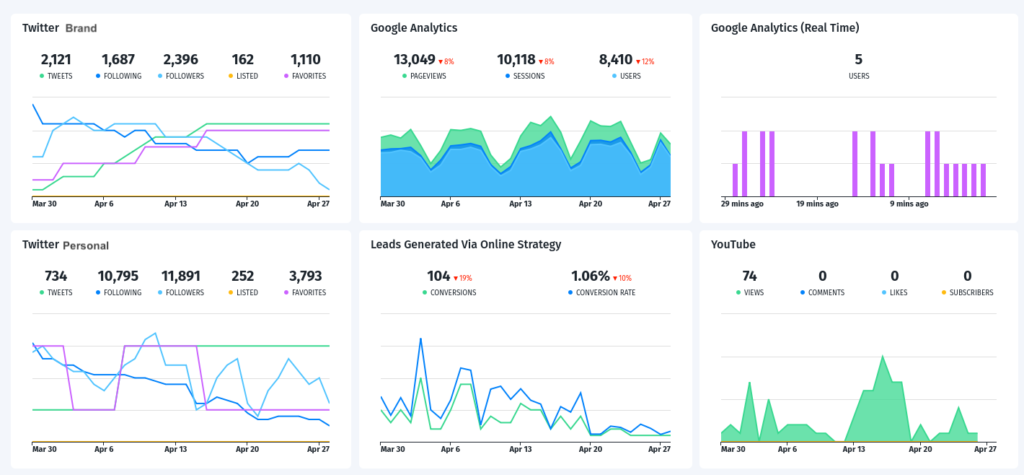
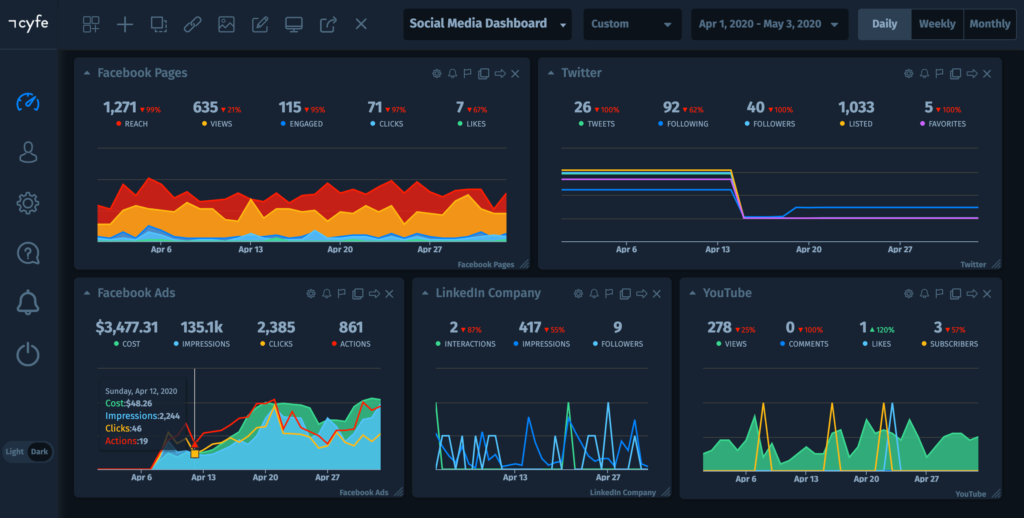
It all sounds like hard work. However, an all-in-one dashboard like Cyfe makes tracking business metrics much easier. You can create goals for each department and monitor their progress by tracking relevant KPIs from one single platform.
But what metrics should you be tracking? First and foremost, they must be relevant to your business and its goals. Saying that, there are some basic but crucial metrics all businesses should be following to keep track of their progress.
5 key business metrics you should track to measure performance
1. Sales Revenue
Tracking sales revenue helps you measure your financial performance. It’s the calculated sales you make by selling your products, taking away the cost of returned items and undeliverables. Month-over-month or year-over-year sales results tell you:
- How interested people are in purchasing your products
- If your marketing efforts are paying off
- Your performance vs. your competitors’ performance
When measuring Sales Revenue and setting goals, consider external factors that may affect your results, such as changes in the market or competitor activity.
The information you gain can indicate whether or not you need to make changes to improve your sales revenue. For instance, perhaps you’re stretched too thin and need to consider hiring new salespeople to take on more customers.
However, it’s good practice to not look at Sales Revenue in isolation when making business decisions. Instead, combine it with other sources of statistical information (like the KPIs below) to understand the bigger picture.
2. Customer Acquisition Costs
Customer Acquisition Costs are the expenses related to acquiring new customers. This KPI tells you how much you’re spending on acquiring a new customer, including the associated costs, such as your advertising spend.
It’s a good way to measure how healthy your growth is – for example, if your customer base is growing rapidly but you’re not making much profit, it could be because you’re spending too much on marketing. In which case, it might be worth working to a tighter marketing budget for a while to see if it affects your customer growth.
Ideally, Customer Acquisition Costs should demonstrate that marketing and advertising are paying for themselves. If they aren’t, perhaps your methods of interacting with customers need upgrading.
Analyzing the ROI from your different engagement channels (social media, SMS, email, etc.) is one way to identify what’s working and what isn’t. You can do this using an analytics dashboard like Cyfe. We talk more about this in Customer Engagement.
3. Customer Churn
Customer Churn is the number of customers who cancel your service or stop buying your products over a set period of time.
You can calculate your churn rate by taking the number of cancellations over a specific period and dividing it by the total number of customers over the same period, and then multiplying that by 100.
For example, let’s say you lost 100 out of 3000 customers in one month. Your monthly churn rate would be 3.3%.
Reducing churn is crucial for business survival: acquiring a new customer can cost five times more than retaining an existing customer. Keeping a close eye on this metric helps you take action before things get out of control.
4. Customer Engagement
If you’re unhappy with your Sales Revenue or Customer Churn, looking at the Customer Engagement metric can open up opportunities to improve your offering and customer service (and, in the process, scale your profits upwards).
For instance, you might want to work out how your customers prefer to interact with your business. To do this, you could compare social, email, mobile and website engagement to gauge which channels (e.g. Facebook or SMS) are providing the most value.
Execute this task easily using an all-in-one business platform like Cyfe. It helps you consolidate all your data in one place to generate game-changing insights. From there, you can concentrate on executing campaigns and engaging with customers through your most lucrative platforms.
You can also measure this metric through customer feedback. Surveys, quizzes, and polls excel at helping you understand your customers’ likes and dislikes. Do they enjoy daily communication? Do they like promotions over helpful blogs? Gathering this intel teaches you how to adjust your approach to get the most out of your marketing efforts.

5. Customer Satisfaction
It’s not only about sales and marketing. Tracking the performance of your customer service is how you measure your reputation and impact.
It’s not an easy task, though. To measure customer satisfaction, you need to understand how your customers are feeling. How do you turn that into a number?
Where there’s a will, there’s a way. CSAT (customer satisfaction) is the metric a lot of businesses use to measure customer happiness. It works like this: you create a scale range and ask customers to rate their satisfaction with your business or its offering using the scale.
You can use numbers, smiley faces, stars, narwhals …. whatever floats your boat to create a CSAT scale. Here’s an example from Userlike:

If your CSAT questions are simple and related to one experience only, customers are much more likely to give you their feedback. How do you calculate your overall CSAT score? Simply add up the sum of all your scores and then divide it by the number of respondents.
The CSAT scale can also be used to measure employee satisfaction which is also an important metric. After all, it’s your employees who are interacting with customers daily. If they aren’t happy, your customers will notice.
What’s in a number?
Where business metrics are concerned: SO MUCH. These golden nuggets of information can mean the difference between success and failure. Take the future of your business into your own hands by making powerful data-driven decisions using the metrics you’ve discovered today.


