Marketers, being primarily a creative bunch, have a love-hate relationship with data and marketing metrics. While rising graphs and impressive charts are what marketers strive for, crunching numbers and analyzing metrics isn’t exactly a very creative activity.
But love it or hate it, there’s no question about it — data is what calls the shots. It proves whether your marketing activities have been worthwhile, and what should be the future course of action.
Now, there’s no shortage of data and trackable metrics, which makes it difficult to infer a coherent story about your marketing successes. It’d be so much easier if all the truly important information was neatly consolidated in one place.
Enter marketing dashboards. A marketing dashboard is a data visualization tool that facilitates the collection and analysis of valuable marketing metrics which are crucial for tracking campaign performance.
Table of Contents
Why Use Marketing Dashboards?
Marketing dashboards are more than a pretty-looking display of all of the critical data. They are useful in:
- Summarizing all the key performance indicators (KPIs) and metrics.
- Simplifying seemingly complex numbers for faster decision-making.
- Sharing data in an easy-to-understand format across teams or with clients.
- Proving to your boss (or client) that the steps you’re taking are in the right direction.
They provide a bird’s-eye view of the effectiveness of your campaigns, making sure you always have the bigger picture in mind. There are several types of marketing dashboards serving different purposes, the notable ones being the following five:
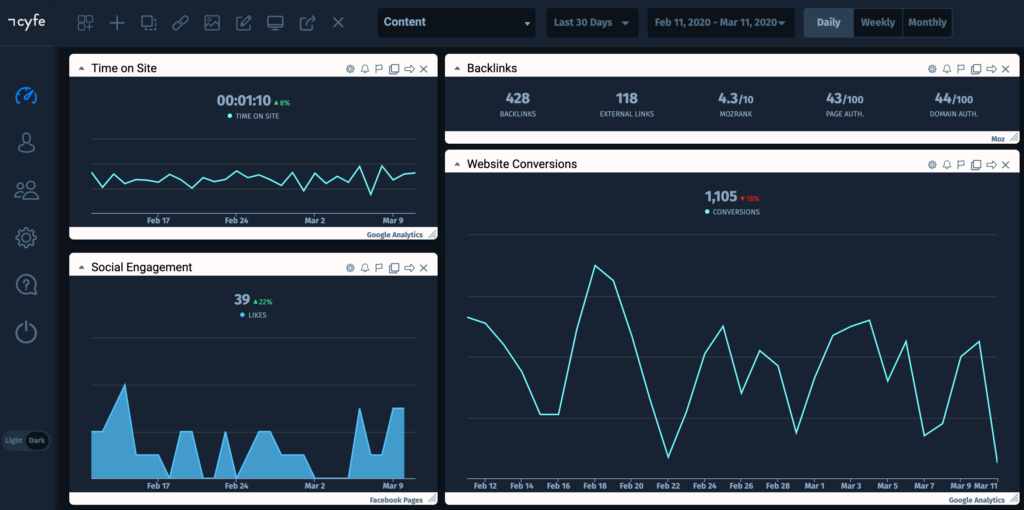
1. Content Marketing Dashboard

Content marketing is an essential activity for any online business today and it often involves extensive efforts from multiple people.
In order to decide what to include on your content marketing dashboard, it’s vital to choose the KPIs that are most relevant to the business you’re marketing. As an illustration, here are a few key metrics that a content marketing dashboard may cover:
- Average time on page: Reviewing the average time on page informs you if the content you’re producing is the right fit for your audience.
- Engagement: Likes, comments, social shares, and mentions are all great indicators that your content is performing very well.
- Inbound links: Tracking the number of inbound links on your dashboard will give you an idea of how much exposure your content is receiving.
- Attributed revenue: To figure out how much your content is contributing to conversions, you may consider tracking attributed revenue using multi-channel attribution modeling in Google Analytics.
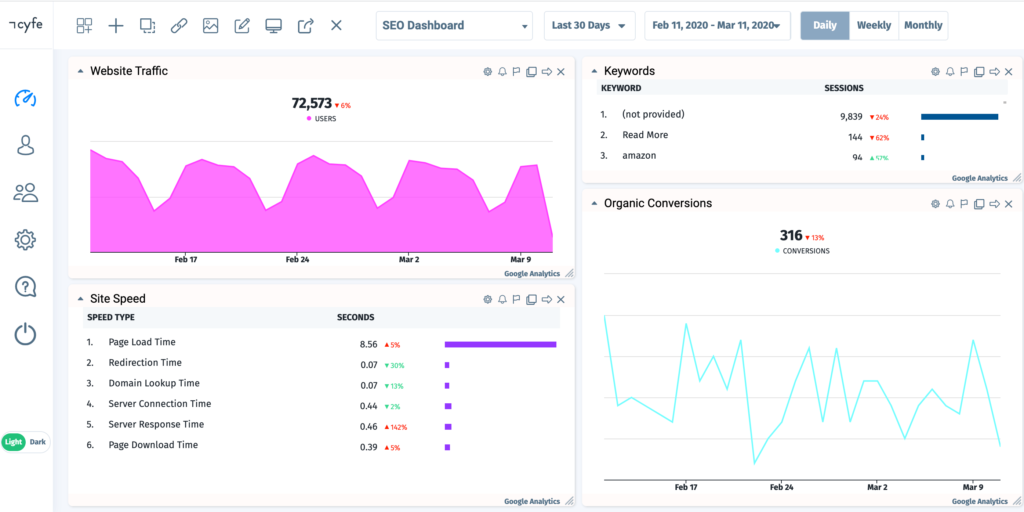
2. Search Engine Optimization (SEO) Dashboard
Here are four critical metrics to track in your SEO dashboard:
- Organic traffic: The amount of traffic generated from search engines like Google is, of course, a key metric to track when analyzing your SEO performance.
- Page speed: Being an official ranking factor for both mobile and desktop searches, keeping your page speed at the very front of the dashboard is pivotal.
- Ranking change: Keeping an eye on your Google rankings is of high priority, as reacting quickly to any major drop in rankings is of the utmost importance.
- Do-follow links: The number of do-follow backlinks coming from quality websites should be steadily growing, as backlinks have the biggest contribution in determining your site’s rankings.

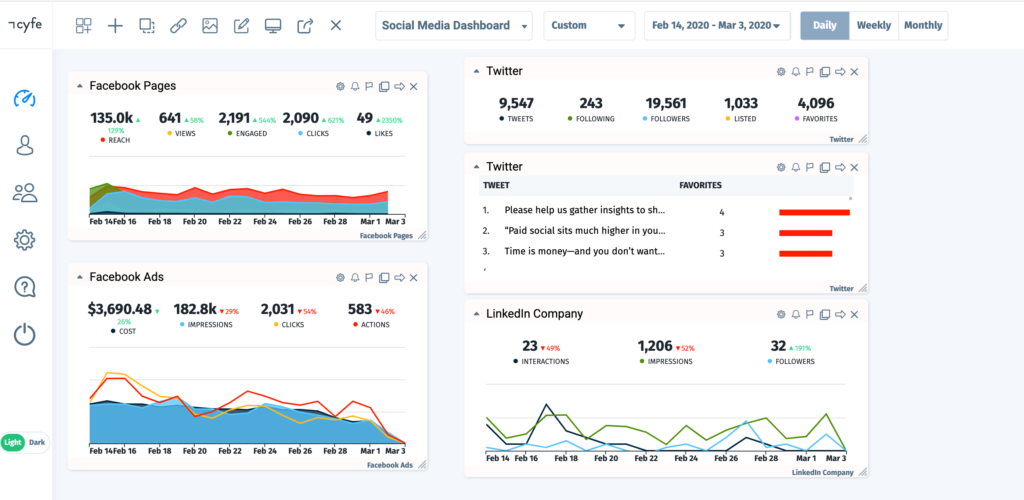
3. Social Media Marketing (SMM) Dashboard
Social media marketing can be both organic and paid. Tracking engagement metrics from various platforms like Twitter, Instagram, and Facebook is essentially what your dashboard will help you do.

While each of these platforms has its own analytics tool, it’s useful to have a dashboard that brings all of those metrics together. A social media marketing dashboard helps analyze demographic data across platforms, compare engagement across all platforms, and get a clear picture of your social media ROI. The following metrics may be tracked:
- Average engagement: This metric relates to the number of likes, claps, shares, retweets, comments, and so on your posts receive on average. Social media marketing is all about engaging with your audience, and so this is an important metric to track.
- Click-through rate (CTR): Ultimately, you want people to click through to the link you’ve added in the caption/bio which could lead them to some landing page on your website. Continuously improving your CTR is important to improve your SMM’s ROI.
- Cost-per-click (CPC): If you’re spending some bucks on social media ads, you must always know how much you’re paying for each click on your posts.
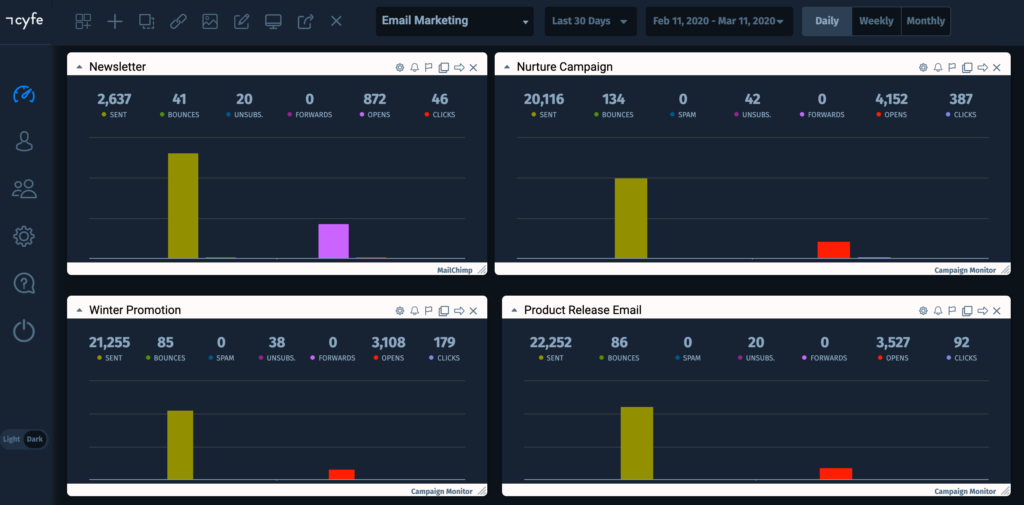
4. Email Marketing Dashboard
Email marketing has always been and will continue to remain one of the most effective forms of digital marketing. That’s because it allows you to communicate directly with people who have voluntarily chosen to subscribe to your marketing messages.
By creating an email marketing dashboard where key metrics are displayed and updated in real-time, you can continuously improve the ROI of your emails. The metrics being:
- Open rate: It is the percentage of the total number of subscribers who opened your email. This number gives you an idea of how well your subject line is performing. Testing and optimizing your subject lines can help improve your open rates.
- Click-through rate (CTR): Again, you want people to not just open your email but actually click through to your website. By improving the content within your emails, you can increase the CTR.
- Unsubscribe rate: The percentage of people that opt-out of your email list. By having the unsubscribe rate on your dashboard, you can quickly get an idea of whether the content or frequency at which you sent that content is appreciated by your audience.

5. Pay-Per-Click (PPC) Advertising Dashboard
If you’re also using paid advertising on Google SERPs as a marketing channel, then having a separate dashboard will help you to easily track and discover short-term results of your PPC campaigns. Here are a few metrics worth tracking:
- Total ad cost: Keeping the total cost of your ads at the very top of your dashboard can be a useful reminder to ensure that what you’re putting in is more than just breaking even.
- Ad click-through rate (CTR): This can help determine how well your ad’s copy is performing. The higher your CTR, the more compelling your ad copy is for the prospects.
- Average cost-per-conversion: By dividing the total cost of conversions by the total number of conversions, you can get an idea of how much each conversion is really costing you in the grand scheme of things.
- Cost-per-click (CPC): Each click, irrespective of whether it leads to a conversion or not, is costing you money. Knowing and optimizing your CPC by tweaking your ads is important.
Final Thoughts
If you overload your dashboard with a ton of KPIs, it’ll be difficult to make sense of what’s important and what’s not, ultimately defeating the purpose of the dashboard.
See to it that the KPIs you’re choosing to display are ones that actually support the overarching goal and facilitate quick decision making. Indeed, having all the vital metrics neatly organized can help you to save both time and money.

Pratik Dholakiya
Pratik Dholakiya is the Founder of Growfusely, a content marketing agency specializing in content & data-driven SEO. He regularly speaks at various conferences about SEO, Content Marketing, Entrepreneurship, and Digital PR.


