
Most marketers know that the most important landing page metric is conversions. You can spend tons of time and resources creating the perfect page, so you want to show your marketing ROI. But did you know there are other critical landing page KPIs you can improve to boost conversions, too?
In this article, we’re going to look at nine different landing page metrics, where to find them in your analytics, and cover how they can boost your marketing strategy and improve conversion rates.
Nine landing page metrics to track and improve conversions
Table of Contents
1. Traffic source
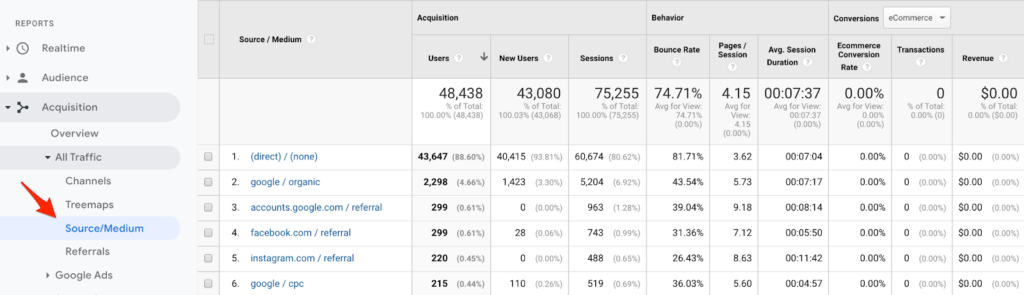
In website analytics, including Google Analytics, a traffic source shows where your landing page gets traffic from. For example, if someone finds your page through a search query, the source is organic search. If your conversion rate is low, it could be because you’re getting traffic from the wrong channels.
Evaluating which channels bring in high-converting website visitors can help you better optimize your page and drive more conversions. Here are some examples of traffic sources to watch:
- Direct traffic: people who directly typed your URL into their browser to go directly to your landing page.
- Referral traffic: people who find your landing page by clicking a link on another website or source.
- Social media traffic: people who find their way to your landing page from a social media post or profile. You can sort by which social network.
- Organic traffic: people who found your landing page from search queries on Google, Yahoo, or Bing.
- Email traffic: people who clicked a link in one of your email marketing campaigns and landed on your page.
- Pay per click traffic: people who clicked on PPC ads (typically in search engine results) to get to your landing page.
In Google Analytics, you can data on your traffic sources in Acquisition → All Traffic → Source/Medium.
2. Landing page views
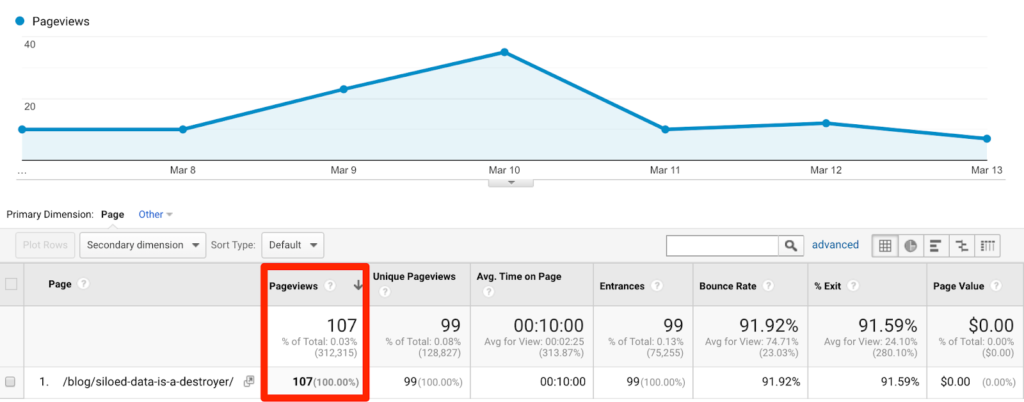
Landing page views, or pageviews, show you how many times your landing page has been seen by a visitor. When pulling up this metric, you can also find out when people visit more often and see what events drove more views. If you’re running PPC ads to your landing page, you can use this information to set specific times when ads will be delivered to help boost traffic and landing page success.
To pull this report in Google Analytics, navigate to Behavior → Site Content → All Pages. Once you reach All Pages, you can tap into specific landing pages and pull up the data.
3. Return vs new visitors
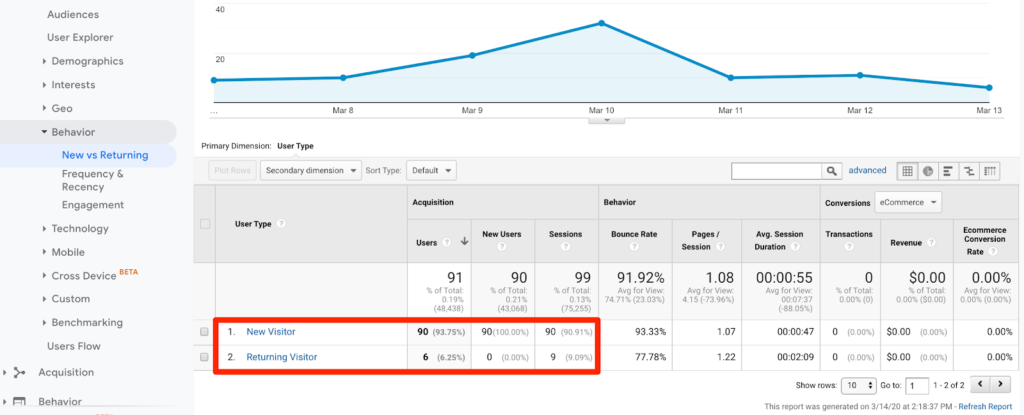
The difference between new and return visitors is pretty straightforward. Regardless, it’s often the most overlooked user engagement metric for landing pages.
Say the goal your lead generation campaign is to generate new leads for your business. For this campaign you’re giving away downloadable content — like an eBook or whitepaper — in exchange for visitors information. If return customers are converting on the page, you may have a good conversion rate, but you won’t have a great funnel to nurture.
To get the data for this metric in Google Analytics, head over to Audience → Behavior → New vs. Returning.
4. Bounce rate
Bounce rate is one of the most important landing page metrics. It refers to the percentage of visitors that leave your website before visiting a second page. Most marketing campaigns run paid traffic to a dedicated landing page, where a person fills out their information and clicks through to a landing page. That would count as a second page visited.
A high bounce rate can mean three things:
- Your audience doesn’t match with the page and doesn’t engage with it.
- Your content is of low quality. There’s nothing keeping people around.
- Visitors find what they are looking for and exit the page.
To find bounce rates in Google Analytics, navigate to Behavior → Site Content → All Pages. Once in All Pages, choose the desired landing page to pull the report.
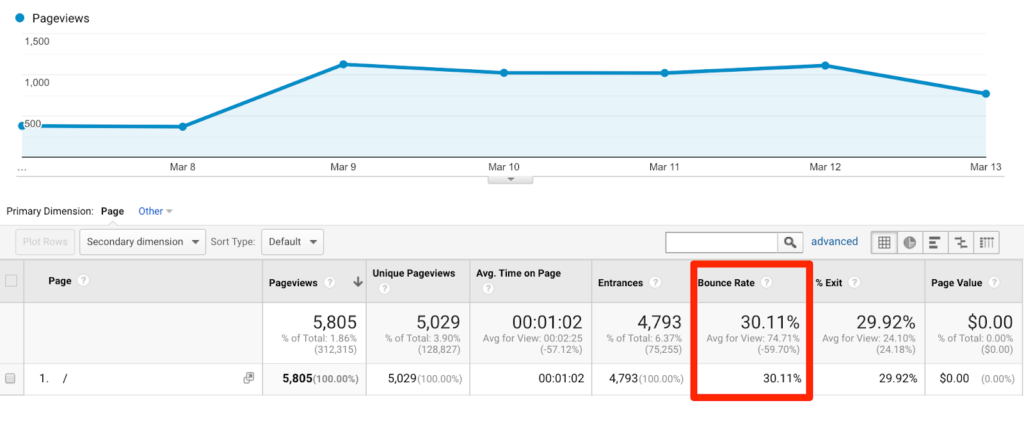
A good bounce rate for landing pages falls into three categories:
- Excellent: range between 26 and 40 percent.
- Average: range between 41 and 55 percent.
- Decent: range between 56 and 70 percent.
Anything higher than 70 percent for a specific landing page for lead generation (not a blog, news, or events) is considered poor. If you’re seeing bounce rates in below average, you may want to work on your conversion rate optimization, or redesign the campaign completely.
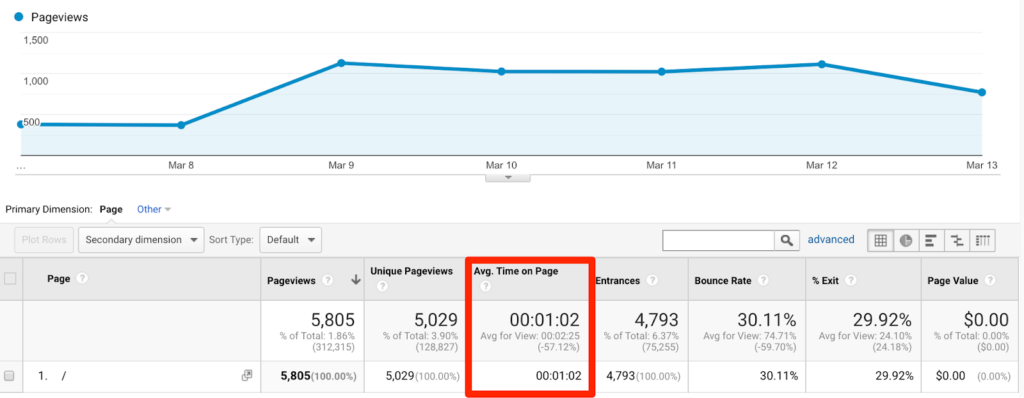
5. Average time on Page
Average time on page is the average of time all users spend on your page. The sole purpose of this landing page metric is referencing if your content is good or not — similar to the bounce rate. The longer people spend on your page, the higher your conversion rates can be.
Pulling this data is the same as finding your bounce rate. Navigate to Behavior → Site Content → All Pages. Once in All Pages, choose the desired landing page to pull the report.
6. Conversion value
Conversion value is the number you assign to a specific conversion on your landing page. This typically represents the future income a lead brings your business.
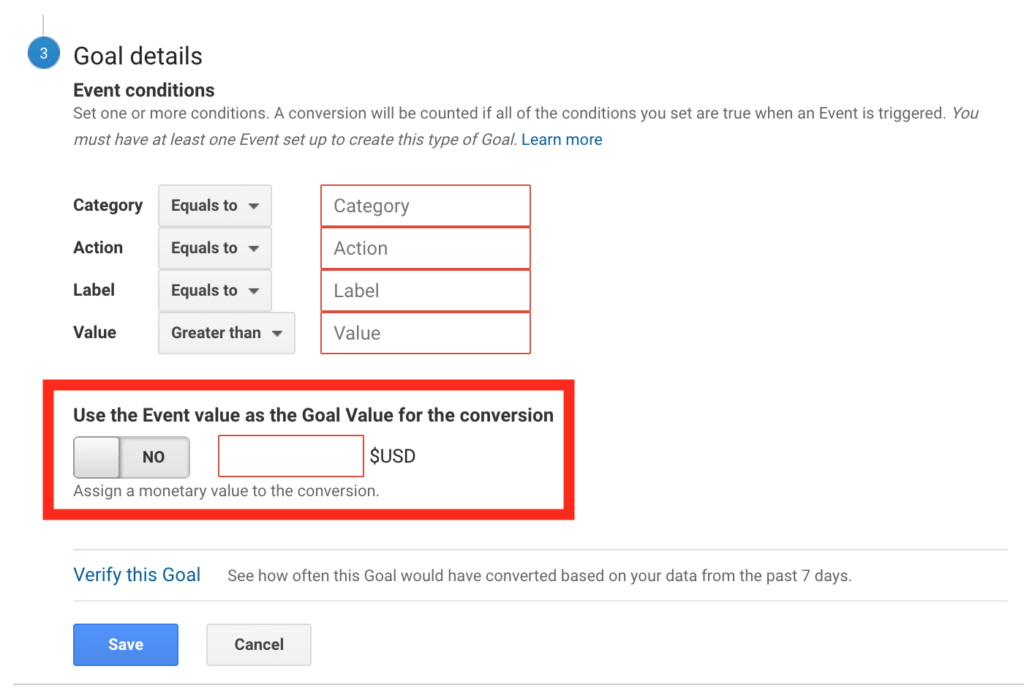
Tracking conversion value shouldn’t be viewed alone in your marketing campaign. You want to monitor as relates to your traffic source, cost per conversion, and new vs. returning leads (amongst others). The benefit of allocating conversion value is to help you optimize and report return on ad spend (ROAS).
7. Form abandonment
Whether you’re optimizing a page for an e-commerce site or a paid digital marketing campaign, you want to track form abandonment. Form abandonment is the number or percentage of people who started filling out the required information on your landing page, then left.
This can happen for a number of reasons. Maybe your form is too much or too sensitive for potential leads.
If you want to improve conversion rates, make sure the information you’re asking for matches the perceived value of your offer. Ask yourself, “Would I provide my phone number for an eBook on data dashboards?”. If the answer is no, then you should probably remove it from your form.
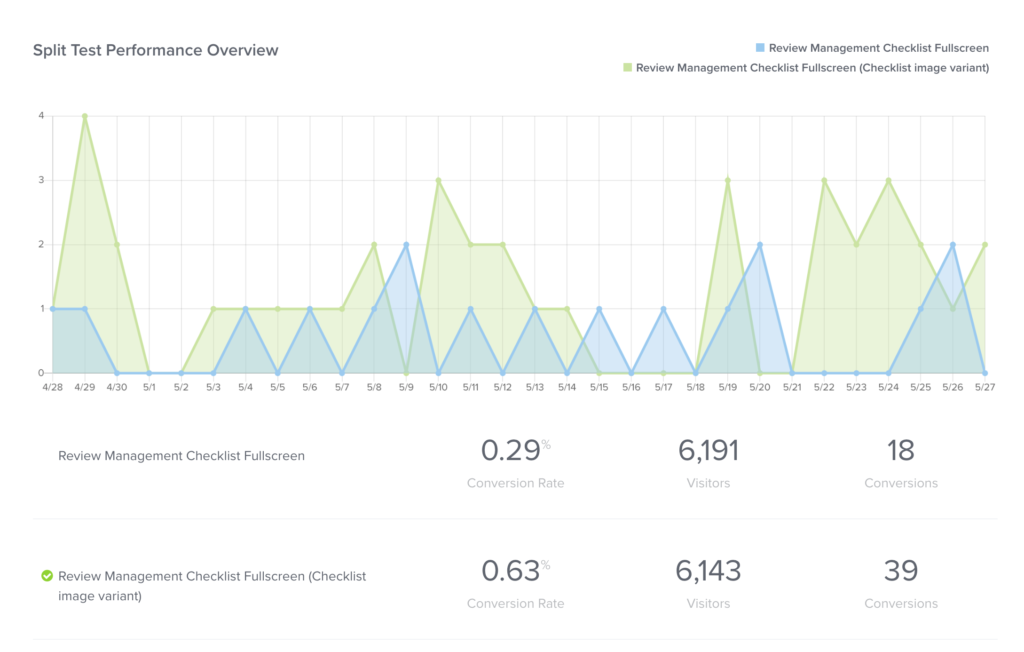
For any marketing campaign, A/B test different forms. When you go to perform a landing page analysis, you can uncover what information people are willing to give, and adjust your fields accordingly.
8. Cost per conversion
Another big landing page metric to monitor is the cost per conversion. Cost per conversion is how much it costs to acquire a new lead. Although you want to increase conversions on your page, you don’t want to drive the cost up to do so.
The equation for cost per conversion is simple: take the total cost of traffic generated to your page divided by the number of conversions. For example, say your ad campaign costs $200 for 100 views. At the end of the campaign, you got 5 conversions. Using this formula you’d see $200/5 = $40. Your cost per conversion is $40.
9. Lead to customer percentage
One of the key metrics you want to measure for landing pages is lead to customer rate. How many leads from each landing page and went on to become a paying customer?
Say you work to improve conversions on your landing page. You check your analytics account and it shows your reaching the target audience, more people are signing up for your offer. But if you don’t turn those lead into customers, your conversion rate is a vanity metric.
Sometimes, landing page optimization goes beyond the key metrics. It may involve changing your offer, targeting a new audience, or reevaluating your sales approach. Lead to customer rate can provide that type of insights for your business so you can make smarter decisions.
Good conversion rates vary depending on your industry and offer, where it falls in your sales and conversion funnel, and the quality of leads being generated. In general, you should expect to see between 5-10% lead to customer rate.
FAQs: Landing page metrics
How do you measure landing page success?
Landing page success is different for each marketing campaign. However, you can focus on key landing page metrics including:
- Conversion rate
- Form abandonment rate
- Cost per conversion
- Bounce rate
- Lead to customer rate
What are the most important Google Analytics metrics?
Here are five important Google Analytics metrics you want to track your landing page:
- Traffic source
- Pageviews
- New vs. returning users
- Average time on page
- Bounce rate
What is a landing page in Google Analytics?
A landing page in Google Analytics is the first page viewed in a session. When checking your Google Analytics reports, a landing page is how someone entered your website.
Making the most of your landing page metrics
To run any successful outbound or inbound marketing campaign, you want to track metrics that matter. If you want to improve your conversion rates and make an impact on your business, track the above nine landing page metrics.
Connect your Google Analytics to Cyfe to easily track and improve on key landing page metrics all in one place. It’s free to get started.


