To succeed in today’s marketing arena, you not only need a great-performing website and strong social media presence, but you also need a solid email marketing strategy based on analyzing and interpreting the right data.
Email marketing requires that you constantly monitor your marketing performance so you can measure your success and improve your results.
Although a lot of marketers only look at a few KPIs, there are actually 10 essential email marketing KPIs and metrics you need to watch so you can get the full picture. Thankfully, there are a lot of email marketing tools like Cyfe that allow you to easily track and analyze your data easily so you can truly optimize your email campaigns.
Table of Contents
With that said, here are the 10 essential email marketing KPIs and metrics to track.
1. Delivery and Deliverability Rates
Before you can worry about whether or not your subscribers open and act upon your emails, you first need to ensure that your emails actually reach their inboxes.
The delivery rate indicates how many emails are accepted by your recipients’ servers. As long as an email doesn’t bounce, it counts as delivered. The formula for calculating the delivery rate is as follows:
Delivery Rate = (Emails delivered / Total number of emails sent) x 100
If you send 40,000 emails to subscribers, and only 38,500 are delivered, it means that your delivery rate is (38,500/40,000) x 100 = 96.25%.
Your deliverability rate is a measure of how many emails actually avoid the spam folder and reach your recipients’ inboxes.
Also known as the inbox placement, this metric is impacted by a variety of factors, such as your domain setup, content, authentication, and your reputation.
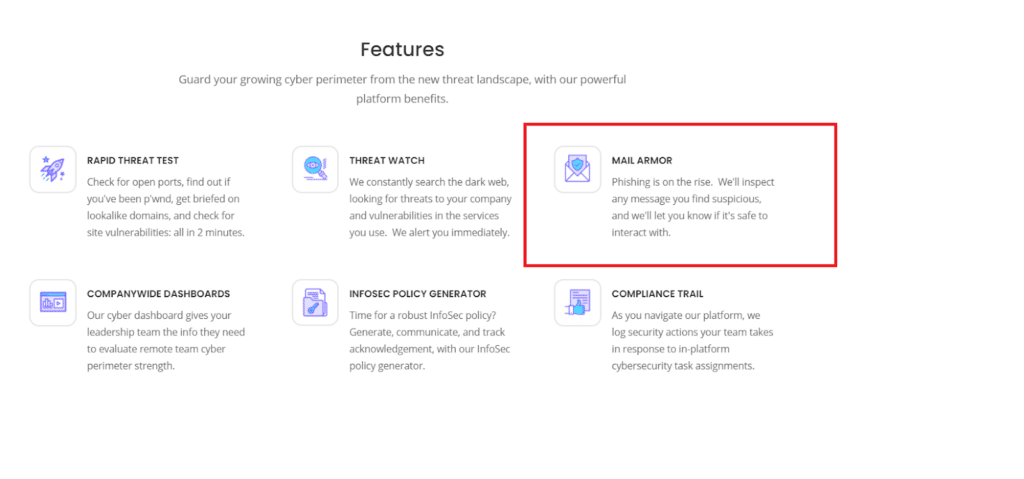
You can use a tool like HavocShield whose “mail armor” feature allows you to strengthen your email security and maintain high deliverability rates.
Pro Tip: When using platforms like Wix or Shopify, opt for a personalized and customized email address to match your domain name and business brand.
2. Open Rate (OR)
Your email open rate indicates how many emails were opened in relation to the total number of emails delivered. Most email service providers (ESPs) calculate this KPI for you automatically. But, you can calculate it for yourself using the following formula:
Open Rate = (Number of emails opened / Total number of emails delivered) x 100
So, for instance, if you send an email to 100 contacts, but only 50 of them open it, your email open rate is (50/100) x 100 = 50%.
ESPs track email open rates by embedding a tracking pixel or a tiny transparent image in your marketing emails and then recalling them each time a subscriber receives your email.
The email open rate is an engagement metric that is very important for you to track. You can study how your open rate compares to the industry average so you know where to focus your efforts to improve your email marketing campaigns.
If you have a weak open rate, there are certain tactics you can use to improve it, such as segmenting your list to ensure that each group of subscribers receives the most relevant content.
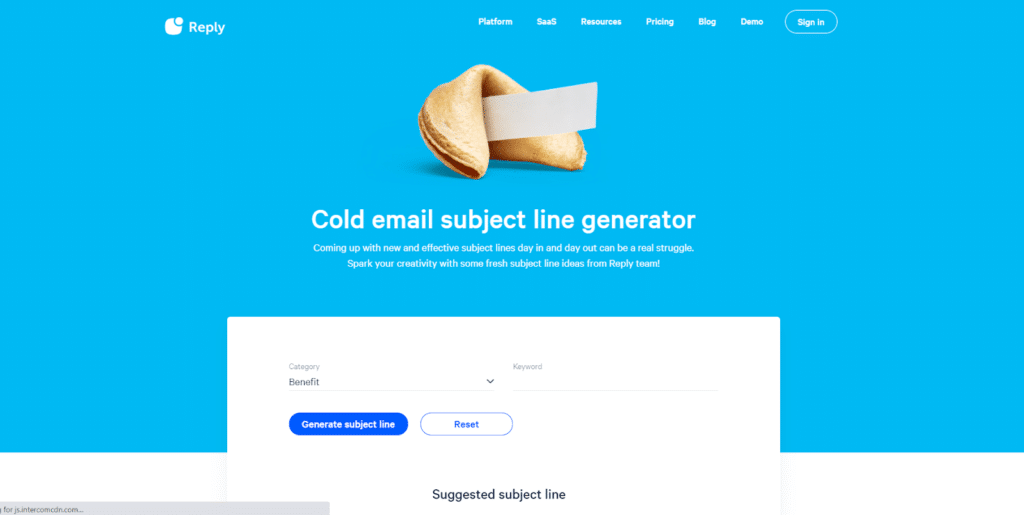
Another way to improve open rates is to add the recipient’s name to your email subject line. You can also use a subject line generator to help you come up with unique and engaging email subject lines.
3. Conversion Rate
Your conversion rate shows you the number of subscribers who took action on your email. It indicates the percentage of email recipients who clicked on a link inside your email and then went on to complete an action, such as:
- Claiming a discount
- Signing up for a free trial
- Making a purchase
- Reading a blog post
- Registering for a webinar
You can use the following formula to calculate your email conversion rate:
Conversion Rate = (Total number of completed actions / Number of emails delivered) x 100
So, for example, if you send an email to 1,000 subscribers, and 50 recipients click the link, it means that your conversion rate is (50/1,000) x 100 = 5%.
You don’t need a digital marketing expert to tell you how important your conversion rate is for helping you determine your email marketing ROI (return on investment). When you know how much you spent on a campaign, and the number of email subscribers converted, it’s then easy to determine if your efforts, as well as the money you spent on the campaign, are paying off.
You can easily measure this metric by integrating your ESP, together with Google Analytics or any other web analytics tool. You can then create a unique tracking URL for individual links within your marketing emails. Cyfe is one such tool as it allows you to track all your key performance metrics and share them with your team.
4. Click-Through Rate (CTR)
Your email click-through rate shows you the number of subscribers who clicked on at least one link inside a given email.
This is among the most common email marketing KPIs and metrics that help marketers to establish how successful their email marketing campaigns are. You can calculate your CTR using the following formula:
CTR = (Number of email clicks / Total number of emails delivered) x 100
As an example, if you send out 10,000 emails, and 500 subscribers click on one or more links inside the email, your CTR will be (1,500/10,000) x 100 = 5%.
The average click-through rate is about 4%, although this figure varies in different industries and can be influenced by a variety of factors.
You will discover that welcome emails and emails calling for specific actions, such as an email informing your subscribers that you are hosting a webinar, will experience higher click through rates.
If you are experiencing low click-through rates, an effective way to improve this essential email marketing KPI is to carry out frequent A/B testing on the different elements of your email, including:
- The wording of the email
- The content layout
- The call to action text and design
- The images in the email
Pro Tip: Use the tips in this graphic design article from Pixpa.com to help you set your email marketing, advertising, and branding apart from your competitors and boost your CTR.
5. Click-to-Open Rate (CTOR)
This KPI shows you the number of clicks in relation to the total number of emails opened. It also measures the number of recipients who clicked on links – but, only for the subscribers who actually opened your email.
This means that the CTOR doesn’t include all the subscribers on your list, or the total number of emails delivered. But, it’s a very accurate metric for measuring your email’s level of interaction. You can calculate your click-to-open rate using the following formula:
CTOR = (Unique clicks / Unique email opens) x 100
If you have 400 unique clicks out of a total of 2,500 unique email opens, then your CTOR is (400/2,500) x 100 = 16%.
If you have a low CTR, but your CTOR is high, it could mean that your emails are well-designed, but that you’re wasting effort and resources sending emails to subscribers who don’t find them relevant.
On the other hand, if you are experiencing a low CTOR, it could mean that your content is uninteresting and is falling flat once recipients have opened your emails.
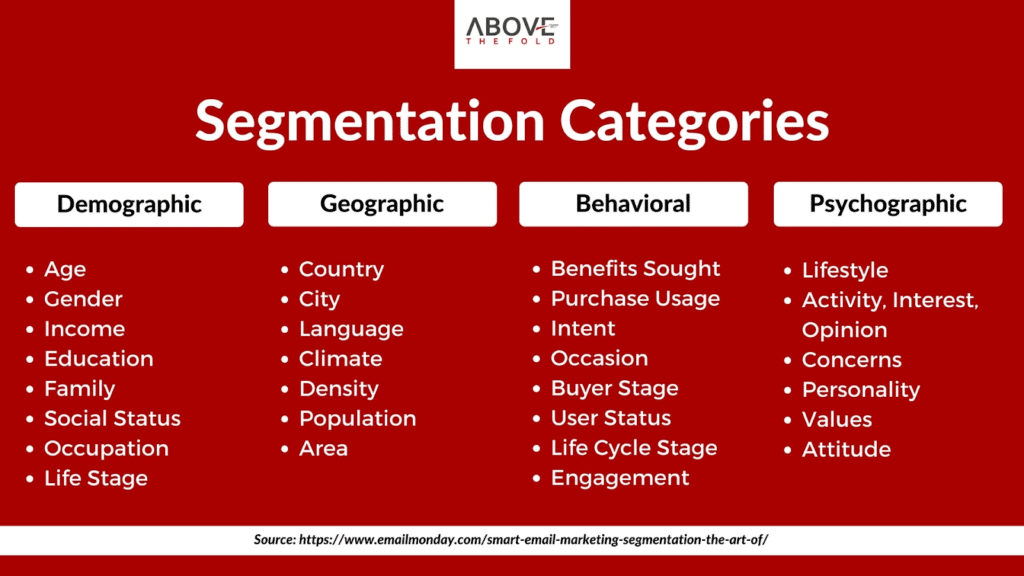
A great way to improve your click-to-open rate is to ensure that you segment your list so that you send relevant content that each group wants. You can use the segmentation categories outlined below as a guide:
6. Complaint Rate
Spam or abuse complaints are among the most important email marketing KPIs and metrics to monitor because they can have a significant negative impact on your email marketing campaigns.
Your complaint rate is the number of times subscribers report your marketing emails either as unwanted or as spam. ESPs calculate the complaint rate automatically using the following formula:
Complaint Rate = (Total number of complaints / Number of sent emails) x 100
If you send 6,000 emails and you get 8 complaints, your complaint rate will be (8/6000) x 100 = 0.13%.
Important Note: Not all ESP’s have feedback loops set up with ISPs, which means that the formula above may not show you a truly accurate idea of your complaint rate. That’s why it’s important to choose the right email service provider to ensure you get a proper sense of your spam complaint rate.
Once you know what your complaint rate is, you can compare it to the industry average, which is about one complaint per 1,000 emails sent, or 0.1%.
This number is acceptable, but any higher than that will likely affect your email deliverability, and possibly result in the ESPs suspending your account.
7. Unsubscribe Rate
Your unsubscribe rate counts the number of recipients who clicked the “unsubscribe” link to show you the percentage of subscribers who opted out from receiving your email messages.
This metric is calculated automatically by most ESPs, but you can double-check your numbers using the formula below:
Unsubscribe Rate = (Number of unsubscribes / Total number of delivered emails) x 100
If you send 5,000 emails, and 20 people unsubscribe, your unsubscribe rate would be (20/5,000) x 100 = 0.4%.
Your unsubscribe rate is likely to fluctuate depending on your email sending frequency. On average, most email campaigns experience a 0.2% unsubscribe rate, and if yours is much higher than this, then it’s cause for concern and you should focus your attention on dealing with it right away.
One way to lower a high unsubscribe rate is by setting the expectations for when you are going to email your subscribers. Stick to a consistent schedule and always deliver on the promise of your subject line.
Also, you should segment your list by interests so that you always send relevant content that your subscribers find interesting using a drip email marketing strategy.
And don’t be afraid to ask for feedback from your subscribers so that you have a better understanding of the type of content they want and expect from you.
Pro Tip: When working to improve your email design and reduce unsubscribes, you can use design resources like these to get your work done faster and more effectively.
8. Bounce Rate
The bounce rate indicates the number of email subscribers who didn’t receive the email you sent. It’s the percentage of addresses that return an error after you send an email.
In email marketing, there are two kinds of bounces: soft, and hard bounces.
A soft bounce involves temporary problems with an email address that is valid, such as a full inbox, issues with the recipient’s server, and so on.
A hard bounce, on the other hand, refers to permanent issues with an email on your mailing list, such as an email address that is either closed or nonexistent.
Whether your emails bounce due to the recipient’s mailbox filters or if you are sending to an address that is incorrect or mistyped, you still need to keep track of this email marketing KPI. You can calculate the bounce rate using this formula:
Bounce Rate = (Number of bounced emails / Number of emails sent) x 100
So, for example, if you send out 12,000 emails, and 80 of them bounce, it means that your bounce rate is (80/12,000) x 100 = 0.66%.
A high bounce rate can cause you to have a poor sender reputation, and this can result in the ISPs viewing your business as a spammer. That’s why keeping track of this KPI is vital to the “health” of your mailing list. It will help you to monitor any email deliverability issues you might be experiencing.
Although there are tons of online business tools to help you with various aspects of your business, it’s important for you to choose the right tools to assist you in reducing your bounce rate and getting more emails into your recipients’ inboxes.
9. ROI
Email marketing ROI is a metric that allows you to evaluate the efficiency and profitability of your investment. In many cases, it’s the main marketing metric you need to monitor in order to accurately measure how cost-effective your email campaign is.
This KPI will show you how much you earned compared to how much you spent to implement your email campaign. To calculate email marketing ROI, use this formula:
ROI = [(Total sales from campaign – Campaign costs) / Campaign costs] x 100
As an example, if you make $2,500 in sales, and your email campaign costs $500 to implement, your ROI would be calculated as follows: [($2,500 -$500) / $500] x 100 = 400%.
On average, email marketing has an ROI of 40:1, which means that for every dollar spent on email marketing, you get back $40! You could build a website and monetize it using the best tactics and still not achieve such an impressive ROI.
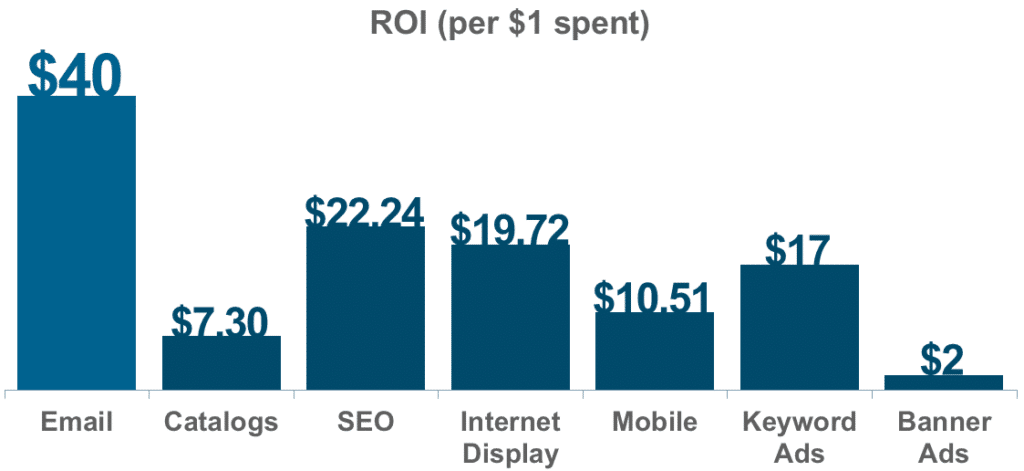
This is why email is among the best and most effective marketing channels you can use for your business.
If you are experiencing a low ROI in your email marketing, you can use the following tips to help you improve your results:
- Divide your list into segments so you can send more targeted emails
- Personalize emails by including the subscriber’s name in the subject line
- Focus on improving your email deliverability rate
- Discover the best days, times, and frequency for sending emails
- Optimize your emails for mobile
- A/B test subject lines and go with the ones that are most engaging
- Include strong calls to action in each of your emails
- Use lots of eye-catching visuals, including videos in your emails
10. Revenue Per Subscriber/Email
It’s estimated that there will be over 4 billion email users by 2024. With numbers like these, it’s no wonder email is such a profitable marketing tool.
The revenue per subscriber KPI shows you how much each subscriber on your list is worth in terms of revenue. This is very important because it allows you to identify the value of your email list.
To calculate your revenue per subscriber, all you have to do is divide your total revenue from email by your number of subscribers, as in the formula below:
Revenue per Subscriber = Revenue from email / Number of subscribers
So, if you have a list of 8,000 subscribers and you send an email that generates $10,000 in revenue, Your revenue per subscriber would be $10,000/8,000 = $1.25/subscriber.
In addition to knowing your revenue per subscriber, you also want to calculate your revenue per email. You can calculate your revenue per email using the following formula:
Revenue Per Email = Revenue from email / Number of emails delivered
This KPI helps you gain valuable insight as to the types of marketing emails that are most valuable for your business. You can then identify the characteristics and trends common to your most profitable email marketing campaigns.
Conclusion
No matter what system you’re using, whether you opt for a popular ESP or predictive dialer software with built-in email marketing tools, these are the 10 essential email marketing KPIs and metrics that you need to know, follow, and analyze so you can accurately measure the success of your email campaigns.
The Cyfe dashboard lets you monitor all the important KPIs mentioned in this article so you can understand your campaign performance.
There are many methods to make money online, but not many offer an ROI as impressive as email marketing.
Which of the email marketing KPIs and metrics mentioned in this article do you currently track? Sound off in the comments!