
Customer experience, or CX, is the broad perception customers form of your business as they progress through their buyer’s journey. CX encompasses every single interaction, positive and negative, that customers have with your business, and it greatly affects the likelihood of not just an immediate purchase, but also future purchases from them and people in their network.
Tracking your customer experience metrics is going to help you improve your reputation, customer satisfaction, and more. It’s never been more important.
Simply put, outstanding buying experiences are now an expectation from modern customers.
According to an Adobe study, companies that prioritized and effectively managed customer experience were three times more likely than their peers to have significantly exceeded their top business goals in 2019. Plus, according to Gartner, CX drives over two-thirds of customer loyalty, outperforming brand, and price combined.
So you may have the best product or service in the market, with a unique value proposition, but that alone won’t cut it. To reach the true heights of your business’s potential, you must have a strong focus on rendering top-notch customer experience.
Now, as Peter Drucker famously said, ”If you can’t measure it, you can’t improve it.” That is, you can only improve your CX if you’re able to correctly measure and track it using the right metrics.
So, without further ado, here are the five key customer experience metrics your small business must track.
Table of Contents
Net Promoter Score (NPS)
The Net Promoter Score (NPS) is a metric that determines a customer’s desire to recommend a product/service or brand to others. It’s measured by asking a simple survey question, such as “On a scale of 1-10, how likely are you to recommend us to your friends and colleagues?”
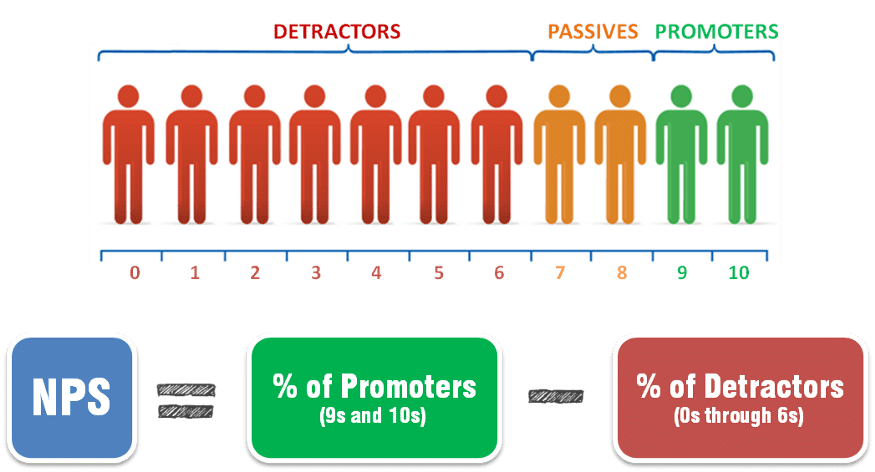
As shown above, the Net Promoter Scale categorizes customers into three groups: Promoters, Passives, and Detractors.
Promoters are loyal customers who would love to spread positive word of mouth. Passives are satisfied customers, susceptible to the marketing influence of your competitors. Detractors are unsatisfied customers who may even advise people against doing business with you.
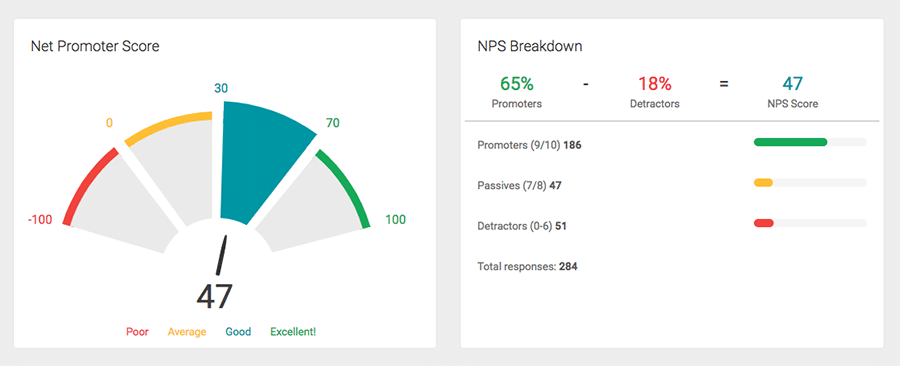
After you survey your customer base, take the percentage of Promoters, and subtract the percentage of Detractors to determine your NPS. The NPS can vary from -100 (everyone is a Detractor) to 100 (everyone is a Promoter).
NPS is a simple yet strong indicator of other vital marketing KPIs like customer churn, average spend, and customer lifetime value, all of which are key to increasing revenue and overall business growth.
Get in touch with your Promoters and encourage them to spread a good word, and contact Detractors to learn where you’re falling behind and what you can do to convert them into Promoters.
Tracking NPS
To track your NPS, use a software tool like GatherUp. It helps store NPS results, track changes and fluctuations in the score, and get insightful feedback from customers on what needs to be improved.
Setting Benchmarks and Evaluating Progress
As such, an NPS greater than zero is considered good, but anything greater than +50 means your CX is sublime.
According to Retently, an average NPS ranges from 27 to 71. The chart below shows the scores for various industries.
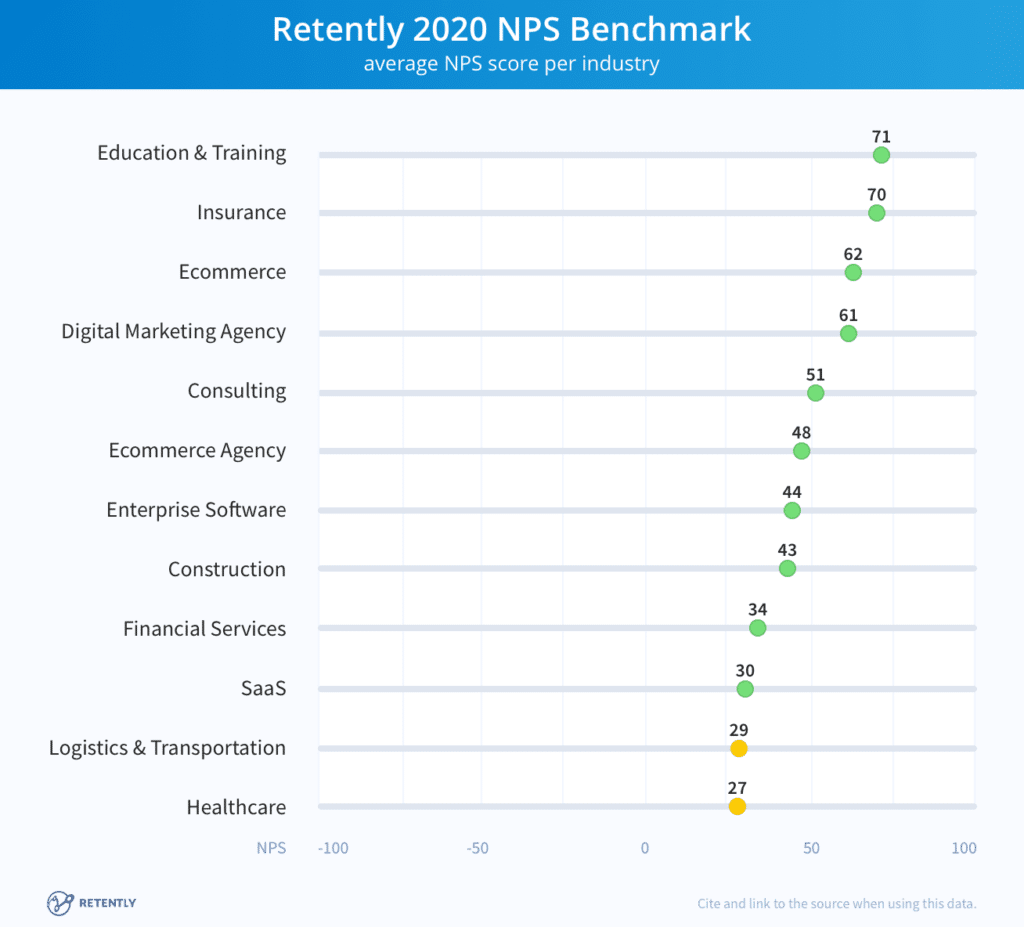
Thus, you can set a benchmark for your business by comparing your current NPS with your industry average and also checking the average scores in your region (for instance, Europeans rate company performances very conservatively and they are less likely to give you 10 or 9s).
Use your baseline NPS as your own benchmark. Keep tracking your score for six months and if you notice a 5-10% increase in score, you’re heading in the right direction and progressing towards building a successful business.
Your goal should be to exceed your industry average. It’s a good idea to measure your NPS at least twice a year so you know how happy your customer base is.
Customer Satisfaction Score (CSAT)
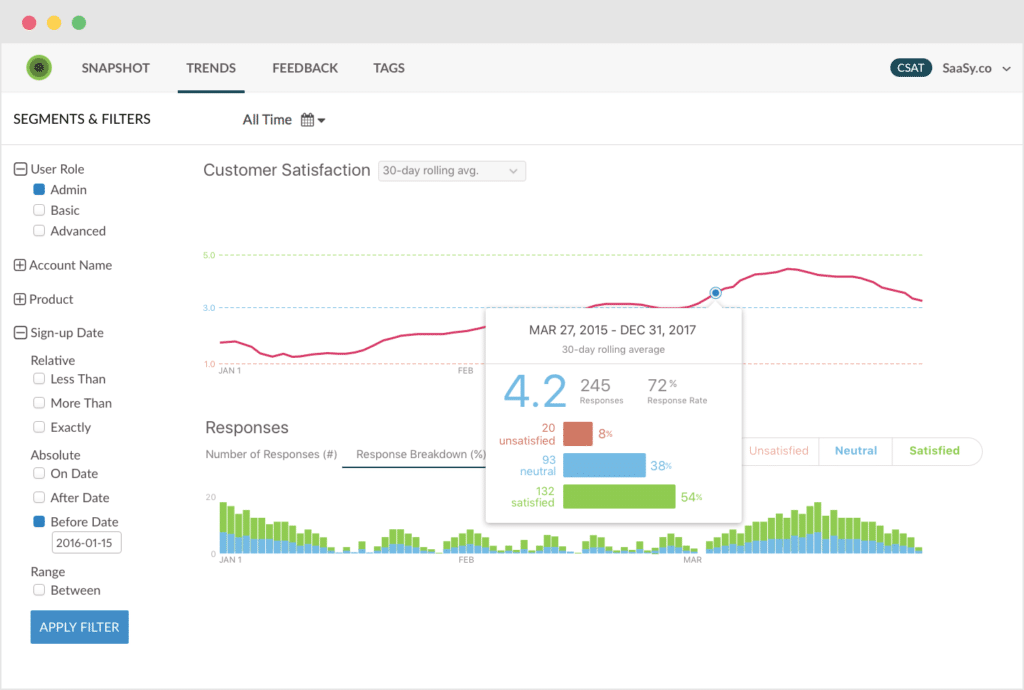
Customer Satisfaction Score (CSAT) is a metric to measure the level of customer satisfaction with your business, be it related to a purchase or a support-related interaction.
This score is also calculated by asking a simple question post-purchase or interaction, such as “How would you rate your experience?”
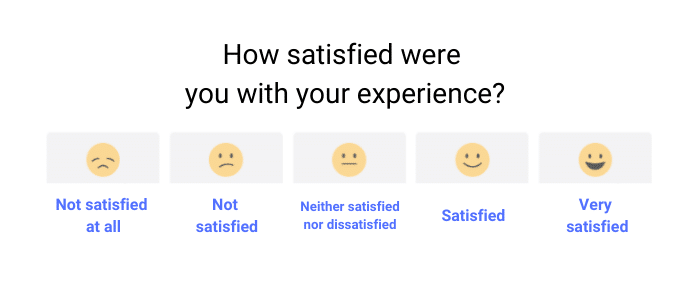
Customers are typically asked to rate their experience on a scale of 1-5, and a CSAT score of 50% means that five out of ten customers gave you a positive score instead of a neutral or negative one. CSAT scores above 70% are deemed good, and over 85% translates to high customer loyalty levels.
CSAT is an easy way to close the loop on customer interactions and gauge whether your business was successful in producing customer satisfaction. And being nothing more than a quick question, you can use it at multiple touchpoints in the buyer’s journey to determine the level of customer satisfaction at each stage and pinpoint areas of improvement.
Tracking CSAT
To track your CSAT, you can use survey software like Wootric or Zendesk. With it, you can trigger surveys at touchpoints based on events such as case closure, feature use, and so on. You’ll get the score and rich qualitative feedback inside your app or website, via email, SMS, or Intercom chat.
It has easy-to-use analytics and you can view your rolling average metric, score distribution, and response counts over time.
Setting Benchmarks and Evaluating Progress
According to the American Customer Satisfaction Index (ACSI), the current overall U.S. Customer Satisfaction Score is 76.5%. However, again, CSAT varies across industries.
Here’s the complete list of the latest industry-wise CSAT benchmarks as per ACSI.
If your industry isn’t listed, comparing yourself to the overall US customer satisfaction score of 76.5% is a good starting point. Let this be your benchmark, with your goal to exceed the industry average.
As your CSAT score complements your NPS, it makes sense to send out the survey at least every six months and keep tracking it alongside NPS.
And while it helps to know where you stand relative to your competitors, the key to success is to always focus on improving your own score and customer experience. Your customers’ expectations are not necessarily being set by your industry’s numbers.
Customer Effort Score (CES)
Reducing a customer’s effort in site navigation, purchase, and receiving support dramatically boosts their overall experience with your business.
Customer Effort Score (CES) is a metric that measures the amount of effort a customer exerts to buy your product, use it, get a problem resolved, or a query answered.
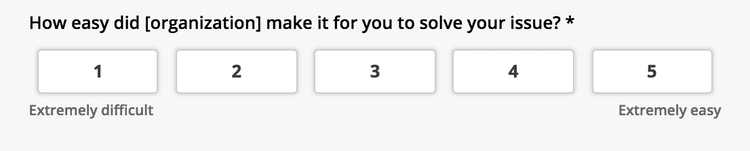
Source: Hotjar
Yet again, the score is obtained from a short survey wherein customers rate their experience on a scale of “Extremely difficult” to “Extremely easy.”
To calculate the CES, add the number of respondents who voted 4 or 5 and divide it by the total number of customers who participated in this survey. So, if 80 out of 100 respondents rated 4 or 5, then 80% of your customers had a relatively smooth and effortless interaction with your business.
Needless to say, customers are more loyal to an effortless experience, which means a score of 80% or higher is what you should be aiming for. You can use CES post-purchase to assess the level of customer effort and figure out how you can make the experience more seamless.
Tracking CES
You can measure and analyze CES survey results with a simple dashboard, and automatically calculate CES scores in real-time as new survey responses come in. You can also identify the most difficult support requests to resolve and track agent performance over time
Setting Benchmarks and Evaluating Progress
As “effort” can mean so many different things in different contexts, according to HubSpot, there’s no definitive industry standard for CES. For each survey, set your benchmark as 4 and track your average post-purchase customer support CES month-over-month.
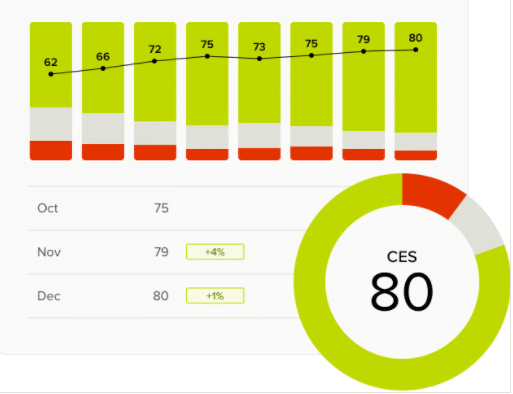
Simply put, your goal should be to keep your CES at 80% or above to ensure your customers are having seamless interactions with your business.
Customer Churn Rate
Customer churn rate is the percentage of your customers who stop doing business with you or don’t renew their subscriptions during a given time period.
To calculate the customer churn rate, divide the number of customers you lost during a specified time period by the total number of customers you had at the starting of that time period. For example, if you start your quarter with 1000 customers and end at 800, your churn rate is 20%.
There are a variety of possible reasons for churn, from poor customer service or user experience to customers finding cheaper alternatives in the market. Keeping an eye on your monthly or quarterly churn is important to ensure consistent levels of customer experience.
Moreover, as it can cost five times more to attract a new customer than it does to retain an existing one, minimizing churn is critical. Even though some churn is inevitable, it’s crucial that you learn why customers are ditching your business so you can provide a more delightful customer experience and thus, maximize the lifetime value of each customer.
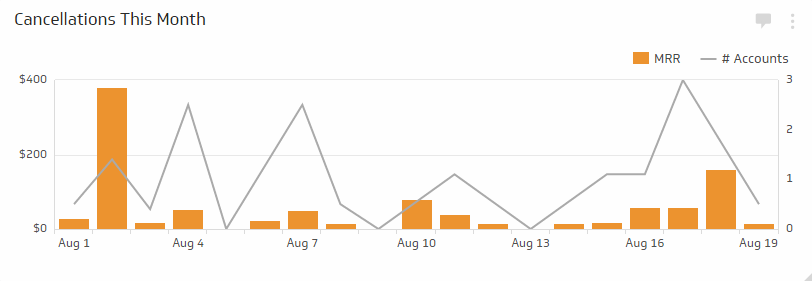
Tracking Customer Churn Rate
To track your customer churn rate, you can use a dashboard tool like Cyfe. With it, you have a centralized way to monitor all of the important KPIs that matter to your small business growth, such as customer lifetime value, churn, and retention rates.
Setting Benchmarks and Evaluating Progress
Owing to the difference in business models, customer churn rates that could be considered acceptable for one business might be disastrous for another. For SaaS businesses, monthly churn rates are typically between 5-7%.
For example, Buffer, the well-known social media management tool, reports a 5.4% monthly churn (or ~48% annual churn). Buffer is a big, established SaaS company, so the idea that they’re losing 48 out of every 100 customers each year may be hard to digest.
However, different industries have different factors that affect churn, and so, churn rates vary widely.
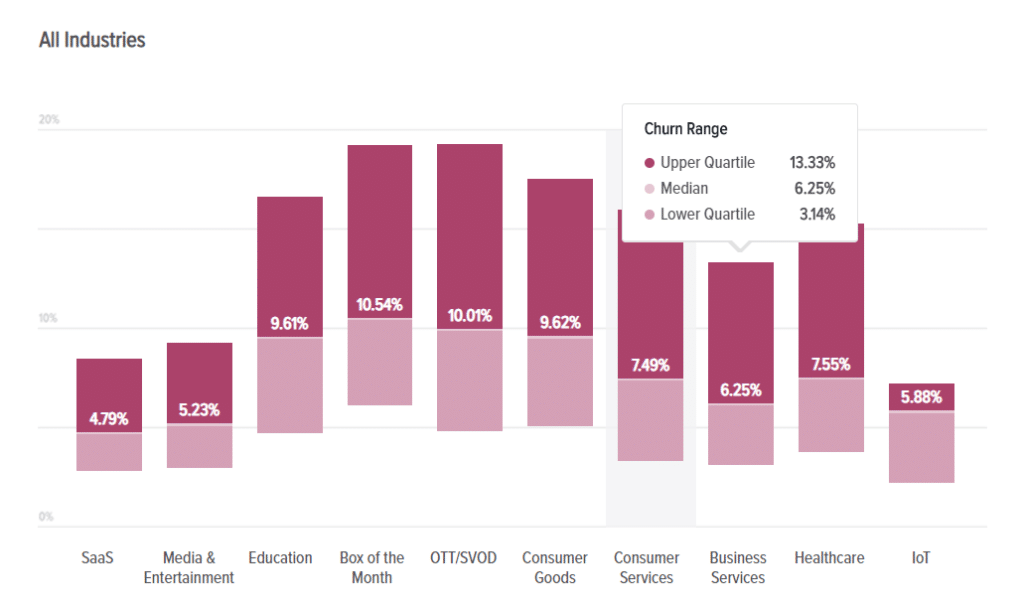
Source: Recurly Research
Price has a definite effect on churn. Higher-priced subscriptions experience less churn, possibly because the purchase is more considered. Subscribers both sign-up and cancel more readily in categories with lower price points.
Likewise, B2C companies experience higher churn (7.05%) than B2B (5.00%). B2B purchase processes can be complex, resulting in a more considered purchase.
You can set your benchmark based on your industry, business model, and pricing. Your best bet is to track monthly churn and aim to keep it under 7%, ideally around 5%. A steadily reducing churn rate is a great sign of business growth in terms of customer retention as well as revenue.
First Response Time (FRT)
The first response time (FRT) is the average amount of time it takes (in business hours) for your customer to get an initial response to their support issue. It is measured by taking the total of all your first response times and dividing it by the number of tickets resolved.
The modern customer simply doesn’t have the patience to wait for their issues to be resolved or queries to be answered. When customers want your support, they want it pronto.
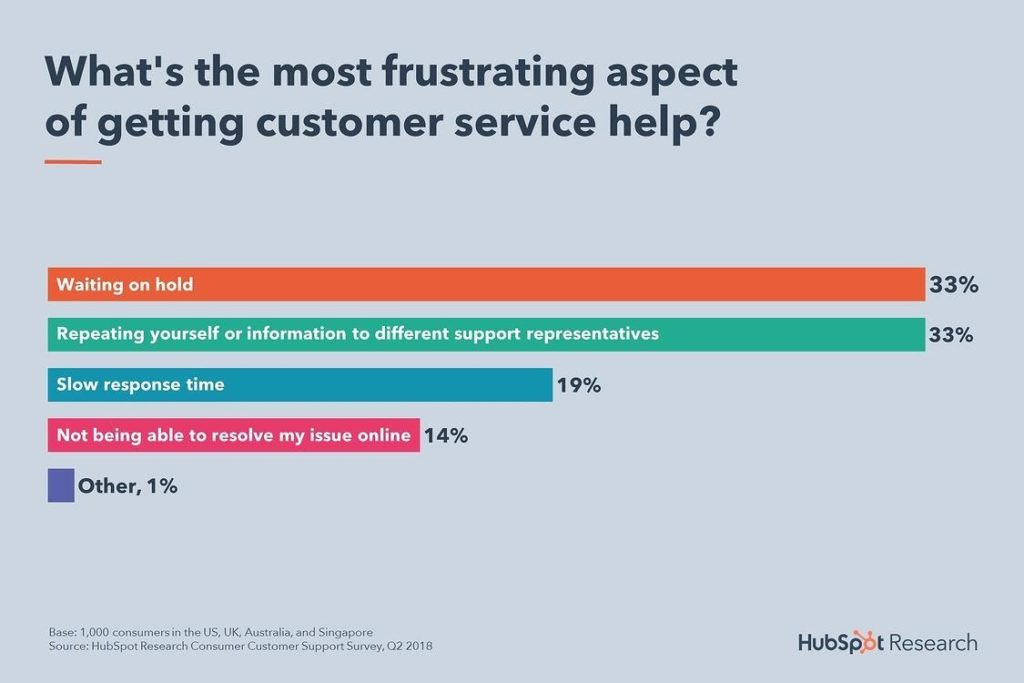
Source: HubSpot
FRT indicates how quickly your team is addressing new support cases and helps you see whether you have enough team members to deal with the volume.
As you’d expect, keeping your average FRT as low as possible is vital to provide better CX. So, analyze the trend of your average FRT on a quarterly basis to see if it’s increasing or decreasing.
Tracking FRT
A great tool you can use to track your FRT is Freshdesk. It provides detailed reports on your customer service performance.
If your business offers support on multiple channels like email and social media, the report also provides separate first response rates for each channel.
This way, businesses can get a clear idea of how your customer service varies by channel, which ones provide the best experience, and which ones have room for improvement.
Setting Benchmarks and Evaluating Progress
The average FRT across all industries is 7.3 hours. But again, there’s a lot of variance between industries, as per Freshdesk’s Customer Happiness Benchmark Report. Some industries have an average of as low as 4 hours, while others go up to 13 hours.
Plus, FRT varies across channels as well. For email, customers usually expect a response within 24 hours. For customer service on social media, the recommended benchmark is to respond within an hour. And for phone support, the generally accepted response time is three minutes.
Based on your industry’s numbers, you can set a benchmark for your FRT. Then, work with your support team to determine a reasonable number to work toward, which can be based on the size of your customer base and number of support reps and channels to handle.
Use that number to motivate your team to deliver faster and better service to your customers. Train your customer service reps, create additional communication channels, streamline internal processes, and hire more reps if needed in order to continually reduce your FRT and thus, improve the customer experience.
Over to You
What sets apart a few renowned brands from countless mediocre businesses is the quality of customer experience. Irrespective of what your business is about and what industry you’re in, a strong focus on creating a remarkable CX is essential to surpass your competitors.
And the only foolproof way to measure and improve your CX is by tracking concrete metrics, instead of relying on hunches.
So, if you haven’t already, it’s time to start tracking these key CX metrics by using a customizable dashboard and turn one-time customers into loyal brand advocates who happily spread a good word about your business.