What’s the point of marketing? You’re putting your business in front of your potential customers. Your marketing message needs to drive revenue, conversions, sales, and other business KPIs.
How do you determine which of your marketing campaigns deserve credit for the conversion? Does your customer’s first interaction with a blog post get all of the credit? How about the ad they clip at the end of their research? Which touchpoint matters the most and how does that impact future marketing investments?
Enter attribution models.
Table of Contents
What are Marketing Attribution Models?
Marketing attribution models are frameworks for determining which touchpoints a lead interacts with that you credit for a conversion. Touchpoints receive (or don’t receive) a percentage value of the credit defined by the attribution model.
Why use Marketing Attribution Models?
Platforms like Google Analytics can quickly show conversions by channels including:
- Organic search ads
- Direct traffic (when someone enters your site’s URL into their browser or visits via a bookmark)
- Social media
- Email (whether it’s from your sales, marketing teams, or customer referrals)
- Referrals (such as 3rd party reviews sites like Yelp or backlinks pushing traffic to your website)
Still, you need to factor in all the prior touchpoints that contribute to a sale. For many buying cycles, your leads may see 6-10 pieces of content before even converting across different channels.
Attribution models give you:
- A plan for comparing the effectiveness of different initiatives.
- A clearer picture of ROI on your marketing activities beyond ad spend whether you need to prove marketing ROI to your clients or your CEO.
- The ability to reallocate your budget based on what’s most effective.
That’s just a few of the major reasons why Salesforce research found 41% of organizations use marketing attribution modeling to measure ROI.
Now let’s look at specific attribution models.
The Most Common Marketing Attribution Models
The attribution models you will use depend on:
- The amount of data you have at hand.
- The number of campaigns you run.
- The funnel stages you are looking to measure.
1. First Click Attribution
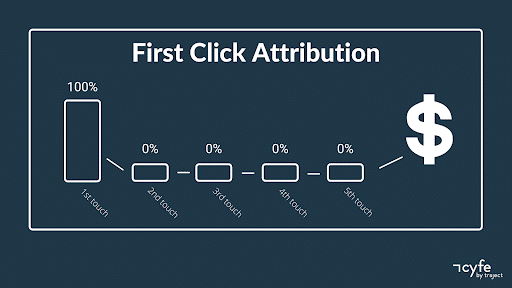
First click attribution assigns all credit for a lead’s conversion based on their first interaction/click. This can be especially useful to see what content or ads drive initial interest that converts. In other words, you can find the top of funnel marketing that is most effective.
All that said, when comparing campaigns you won’t be able to see what other touchpoints influenced a conversion except the initial interaction if you only use a first click attribution model.
2. Last Touch Attribution
Last touch attribution is also a single-touch model. Instead, it assigns 100% of all value to the last click. Last touch attribution lets you see your strongest channels for converting leads if your sales cycle is short. You can also compare how much specific offers convert such as discounts served through ads.
Using this model alone you will only be tracking the final interaction and won’t be able to see if there are any bottlenecks in your campaigns.
3. Time Decay Attribution
Like linear attribution, time decay factors in all interactions you can trace. However, a time decay model gives more value to touchpoints that happen closer to a purchase. The first interaction gets less and the last interaction receives the most credit.
If you’re working with long sales cycles, this can help you drill down to:
- See what touchpoints closest to the last one before conversion provided value.
- Figure out if they interact with a cluster of content before converting.
Then you can iterate on your middle and bottom of funnel activities.
This model requires more advanced tracking you won’t get out of the box with Google Analytics. It also doesn’t show the value of the top of the funnel content.
“Generally, the more expensive your product, the longer you want to open that window. Facebook allows you to keep the window open up to 90 days to track data and see how many touchpoints there are,” said Sandro Galindo on the Sandro & Liz Marketing Podcast.
“A good place to start for most businesses is that one day decay just to divide the attribution, give it more weight to the most recent, and less weight as time goes on.”
4. Data-Driven Model
The data-driven model uses the algorithmic model in Google Analytics 360. The algorithm factors in all the conversion paths of your leads and sets values on each interaction based on their importance in the conversion process.
This model is advertising-driven as Analytics 360 requires a Google Ads account with at least 15,000 clicks on Google Search and a conversion action with at least 600 conversions within 30 days
5. Linear Attribution
Linear attribution places equal credit to every touchpoint your lead interacts with before converting. This model reinforces:
- The value of each step in your funnel.
- The average B2B buyer reads 10 pieces of content before purchasing.
- The overall campaigns that are driving leads for your brand.
Here’s the catch, though: Due to the equal distribution of credit, linear attribution does not highlight which specific marketing activities are more effective.
6. Position-Based Attribution
Position-based attribution, also known as u-shaped attribution, looks at your lead generation efforts. This model places value with:
- 40% going to the first touch.
- 40% to the point where they become a lead (e.g. they request a demo).
- 20% equally distributed across any touchpoints between the other two touches.
If you hand off leads to your sales team, you can see which touchpoints generate the most initial interest and entice leads enough to provide their information. But by design, this model assumes the first and last interactions are the most important parts of a customer’s journey.
7. W-Shaped Attribution
W-shaped attribution takes the idea of u-shaped models one step further. Along with the first and lead creation touches (credited 30% each), this model gives 30% to the final touchpoint before a lead becomes a customer. The remaining 10% goes to all other interactions a lead has with your brand.
This can help you see which marketing activity pushes a lead to take the next step in your funnel. In other words:
- The first touch shows what ad, blog post, or other marketing initiative led to an anonymous user reaching the top of your funnel.
- A user opts into downloading your eBook or subscribes to your newsletter, hitting your mid-funnel content.
- At the bottom of the funnel, you can see if a lead reads a product comparison whitepaper or receives a one-time-discount offer and then converts.
8. Custom Attribution
With custom attribution models, you set the rules on how much credit different interactions receive on a lead’s journey. If you have a specific campaign and the existing data you need to determine the most important touchpoints, custom models can be valuable.
Simpler models are a better fit in the beginning though if you’re:
- Creating initial campaigns and need to establish benchmarks.
- Working on personalization campaigns.
- Moving upstream to higher-value target clients.
How to Measure Marketing Attribution with Custom Models
There are two key ways you can create custom models:
- Through an experienced data scientist that has access to business intelligence tools
- Create custom models off a default model in Google Analytics
Here’s how to create a custom model in GA:
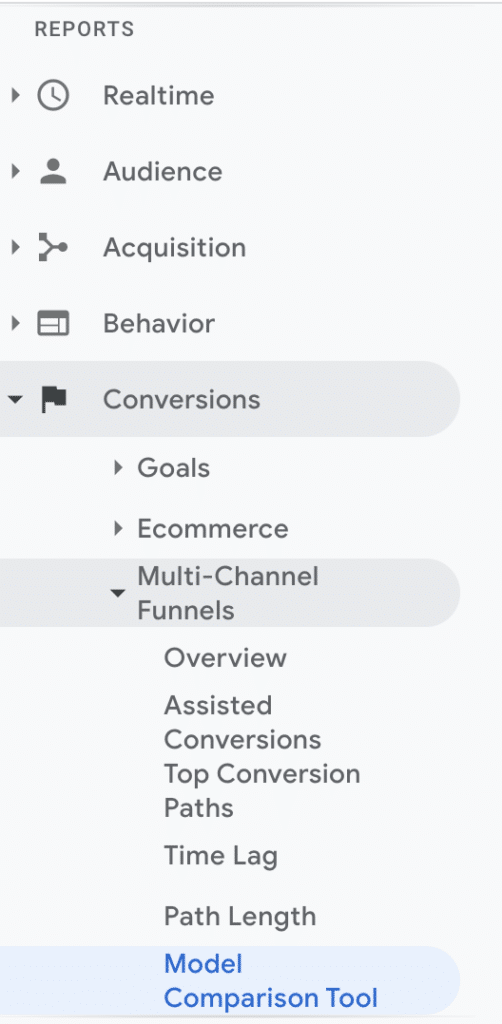
- Select Conversions > Multi-Channel Funnels > Model Comparison Tool
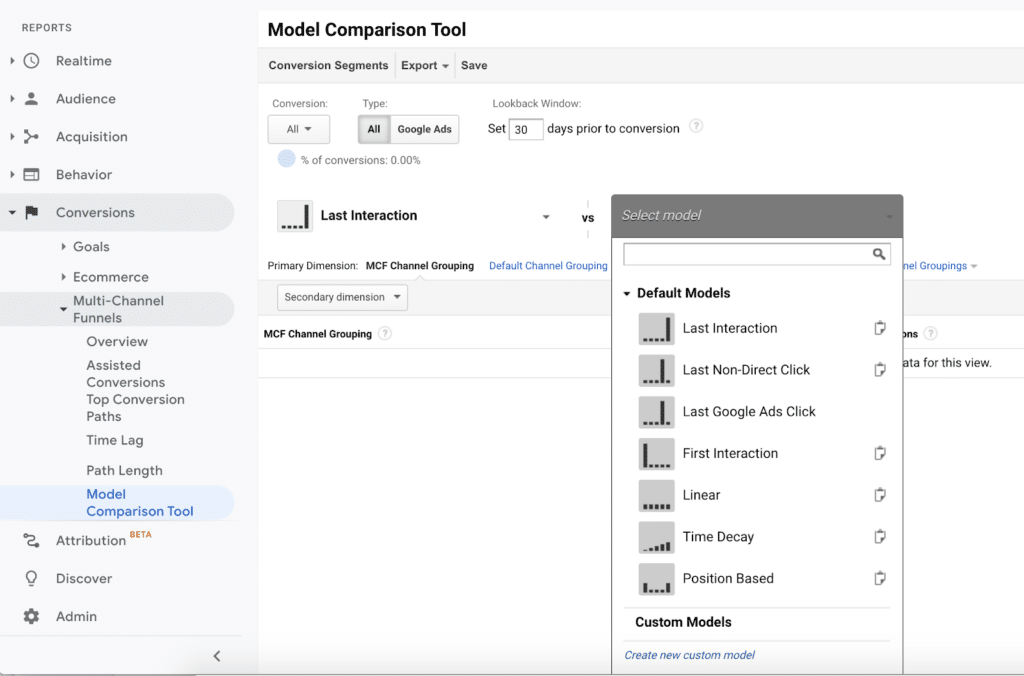
2. Click into “Select model” and choose “Create new custom model”
3. Give your model a name and select a baseline model you can customize from
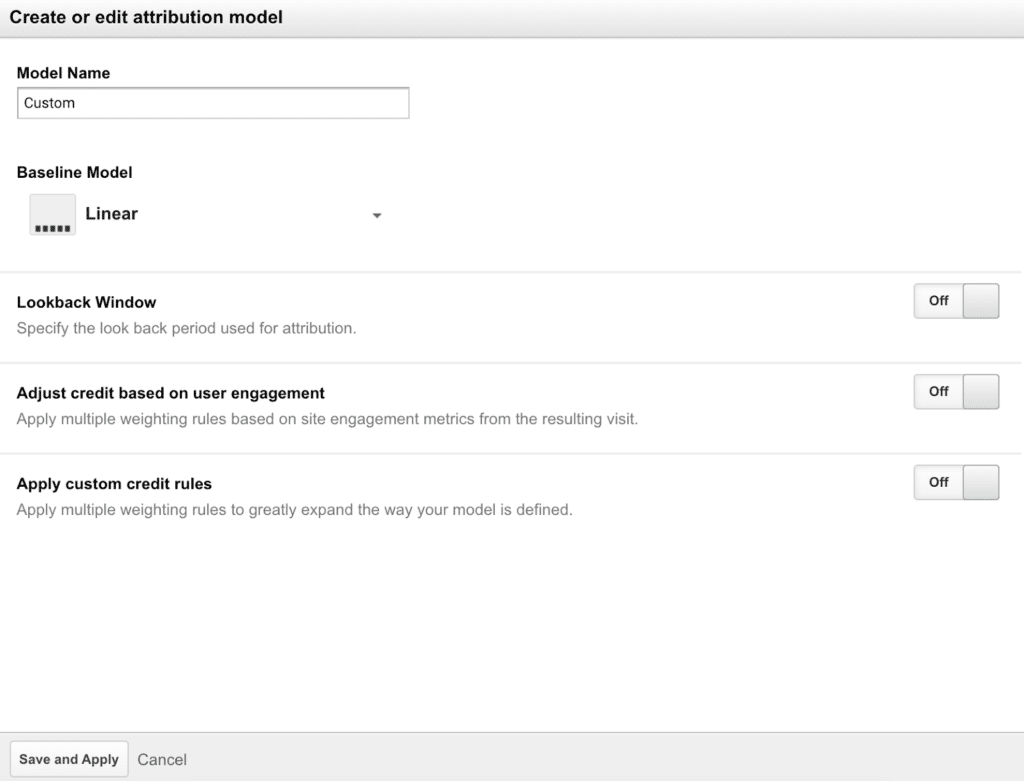
4. Toggle your desired customization options including:
- Lookback window (the total amount of time a touchpoint can go that you want to credit in your attribution model) so you can factor in your sales cycle into your attribution model (the max time allowed in Google Analytics is 90 days prior to a conversion).

- Automatically adjust credit based on how much a user engages with content based on time on site or page scroll depth.

- Set custom rules that define how much credit each touchpoint gets based on conditions being met.
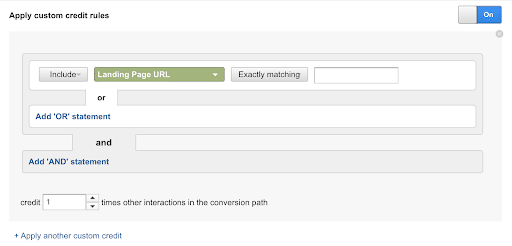
5. Once you’re done, click “Save and Apply.”
Summing It Up
To track the effectiveness of all your marketing spend and what content pushes leads further along to buy, you’ll likely need more than one attribution model.
Once you have attribution models set up in platforms like Google Analytics, you can view your KPIs and attribution measurements in a single dashboard using Cyfe.
Dashboards let you analyze code free and access all the data you need. Bring together in minutes all your data sources such as:
- Google Ads
- HubSpot
- Salesforce


