
Looking to ramp up your advertising game? Or, maybe you’re new to the space and are ready to test drive some ads. Our recommendation: keep your eye on the prize by setting goals ahead of time using an advertising dashboard.
Metrics, in this instance, are key performance indicators (KPIs) that determine the success or failure of your advertising campaign. Of course, we’re aiming for success!
Without benchmarked KPIs set in advance, you’ll have no way of knowing if your advertising campaign is successful or not. So, consider setting goals on your advertising dashboard for the following straightforward starting points:
- Total number of ad impressions, or how many times your ad is displayed
- Total number of views, or eyeballs that see your digital ad
- Number of click throughs your ad delivers to a landing page or to your website
- Amount of time users stay on your landing page or website
- New customer acquisitions
- Total revenue gained
Then of course you can, and should, dig a little deeper.
Advertising Dashboard Metric #1 – Impressions
Every time your digital ad is displayed, it counts as one impression. Say, for example, your ad pops up 1,000 times and you have 1,000 impressions. This specific metric doesn’t really mean much by itself, but when calculated against other metrics you can begin to get an understanding of the success of your ad campaign. If you have that same 1,000 impressions and 500 people click on your ad, you have a 50% click-through rate percentage (see #2) and that’s awesome.
Advertising Dashboard Metric #2 – Click Through Rate (CTR)
A click-through rate ultimately measures the total number of people who click on your ads. Click through rates measure the ratio of impressions (number of times your ad is seen, which can be done multiple times by the same person) to actual clicks. CTR is how you can measure the success of your ad and how you can tweak it going forward.
For example, maybe you have a higher CTR when your ad is green vs. blue or when you use the image of the ocean vs. the flower. An essential metric, CTR is a great way to measure your ads creativity and to discover calculated ways to improve your campaign.
Advertising Dashboard Metric #3 – Bounce Rate
Bounce rate is an important advertising dashboard metric. One of our favorite ways to think about how to define bounce rate is to compare it to partying at a club. If the club is happening, you’ll want to stay, but if it’s not, you’re going to want to bounce, or leave. So, it’s a bad sign when a user clicks on your ad and then bounces quick. You want a low bounce rate which means that people are clicking on your ad and then hanging out on your landing page or website, digesting and interacting with its content.
Should you find that you consistently have high bounce rates, we suggest re-evaluating your ad’s landing page and even the language in your ad. Be sure your landing page is user-friendly, easy to understand, and engaging. Also be sure that the promises or implications made by the ad relates to the landing page.
Advertising Dashboard Metric #4 – Time Spent on Site
Time spent on site is a metric that goes hand-in-hand with bounce rate. The more time users spend on your site, the better. In an ad campaign, longer time spent on site usually means that your digital ad message aligns well with what your website and services have to offer. You’ve appropriately teased a benefit that makes people want to click and learn more about the types of services your business provides.
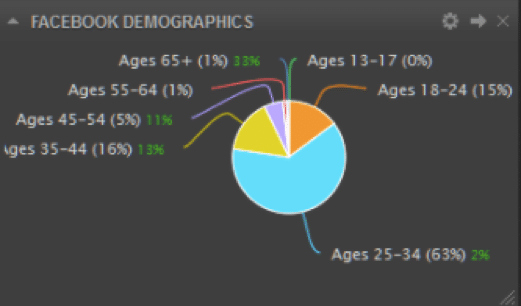
Advertising Dashboard Metric #5 – Demographics
Of course you want to know the total number of clicks, views, and total acquisitions your advertising campaign delivers on, but it’s also incredibly useful to know who your most interested audience members are. It’s safe to say you’ll likely have some guess as to your online demographic before you begin an advertising campaign.
Social media and marketing dashboard analytics can give you some of this information ahead of time and it can be used for ad targeting. If you haven’t looked at social and marketing yet, fear not. Your advertising dashboard information will vary with your advertising audience. Either way, collect all the metrics you can surrounding your audience, so you can improve your targeting and continue to boost your bottom line.
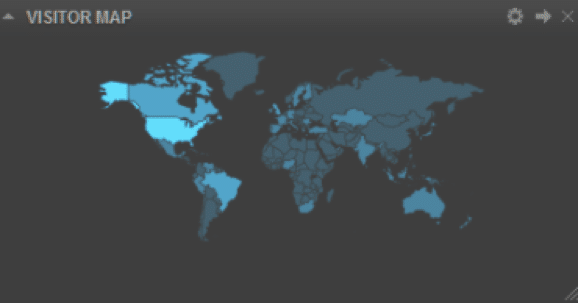
Where is your audience coming from? Your advertising dashboard will tell you if your visitors are local, international, or from exactly where you were hoping them to be. The dashboard will break down audience locality into city, county, and even neighborhood if you wish.
When are they visiting? Knowing what time of day and on what days of the week your ads tend to be most successful is key to spending more dollars on the right place and time.
How are they finding you? Your advertising dashboard will report on how your audience is finding your ads be it from a mobile device, tablet, or computer. Cyfe’s advertising dashboard even breaks device type down by brand.
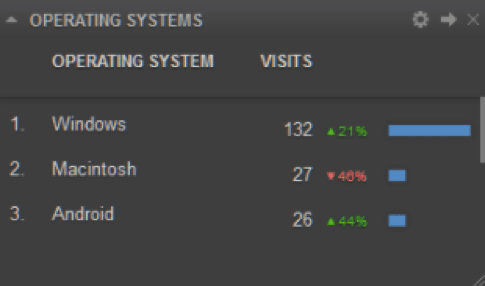
If you find, for example, that your mobile ads are more successful, you can reallocate your spending to focus more on your mobile device ad spend.
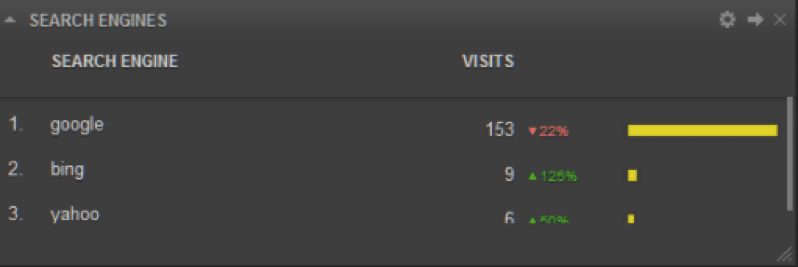
Your advertising dashboard will also inform you of which search engine is working best for your ad.
In this example Google is the clear winner, but you may find that your online ad gets more value, based on cost and total impressions, on another search engine. Test each until you find your ad finds its sweet spot.
Advertising dashboard metrics can even let you know more obscure levels of detail like what users were searching for or viewing online before they clicked on your ad.
Who are they, really? A great advertising dashboard from an all-in-one online business dashboard like Cyfe will dig even further in its ability to share with you likes and interests of your advertising campaign viewers and clickers. Use this information to set up future campaigns that target sites where your audience is most likely to be.
Advertising Dashboard Metric #6 – Cost-Per-Click (CPC)
This one is pretty straightforward, but to be clear your cost-per-click measures the cost of each individual click on your digital ad. Cost-per-click answers the question: How much in total am I paying for a single person click on my ad?
Obviously, you want your CPC to be as low as possible, but know that you should also be considering this with respect to your total ROI (see #7). If your CPC rate is high, but your ROI is also high, things may just even out. Just be sure to look at the full picture and make sure you’re ultimately on the up-side. If not, you’ll need to rethink your ad campaign and its spend.
Advertising Dashboard Metric #7 – Return on Investment (ROI)
Finally, and perhaps the most important metric of all — your earned revenue. You definitely want to know the overall return on your investment earned from your digital ad campaign.
Online advertising is not free. So, you’ll need to map out your budget ahead of time and account for dollars allocated to labor that may include costs associated with employees or vendors.
Select the period of time your ad was live and look at your total returns from the ad’s tracking link during that time. Divide that return by the cost of your ad and you have your total ROI. Your advertising dashboard can then help you determine your cost-per-click (CPC). In other words, know how much you are spending to earn each individual click on your ad.
One of the best parts is that your advertising dashboard will continue to calculate these numbers in real-time so you have a sense of your current earnings at any given moment.
The Awesome Advantages of an Advertising Dashboard
We’ve discussed a few of the more common and essential advertising dashboard metrics, but as you might imagine, there are many more. Sure, you can craft detailed and likely tremendous spreadsheets to track your metrics, but a powerful advertising dashboard seamlessly delivers the following advantages.
- Helps streamline and deliver your most important KPIs when you want them
- Creates easily shareable data in multiple formats
- Collects real-time data so you are aware of your ad campaign performance in-the-moment
- Alerts you automatically when campaign spends have reached their limits
- Sends you updates via email or SMS-messaging
- Allows you to view your metrics on-the-go using multiple device types
- Sets up project management tasks so you and your team can mastermind your advertising campaign for greater success
Your advertising dashboard — don’t leave home without it! Save time and get the metrics you need fast. Make your advertising dashboard work for you so you can focus on customer needs and business growth.
Get started with Cyfe today for free. No credit card. No obligation. Just insight! Crush your online sales game with an advertising dashboard that goes to work for you. Gain access to your small business analytics and take action.