
Small business analytics is the silent driver of successful companies today. Every owner knows their work impacts the bottom line — spikes in traffic, more sales — but they don’t always know what’s making the most impact and why.
The problem is, there’s so much data available today it can be overwhelming for a small business owner. Wrangling data takes the right tools, the right metrics, and the right application to build a sustainable long-term business.
To lessen the burden of small business data analytics, we’ve put together a guide below that discusses four ugly truths (and how to fix them), plus, six best practices you can use to understand the health of your small business and make more informed, strategic decisions.
If you’re short on time, click to a section that interests you the most:
Table of Contents
4 ugly truths about small business analytics
With the amount of data that’s available to you, it’s easy to misunderstand and misuse it. And if you don’t jump on specific mistakes early, it can negatively impact your bottom line. Below are some common issues around small business analytics and how you can overcome them.
1. Small business owners know they should be using data, but they don't.
Many business owners decide to focus on revenue-generating activities like lead generation or advertising. Analytics has become something owners fear because of lack of time, resources, technical knowledge, etc. The truth is, data wrangling is profitable once you get over the learning curve. Once it’s set up, you can start making more strategic decisions for your business and grow revenue.
For example, Don Marler, a street food vendor, achieved a 30% revenue boost by tapping into his customer’s geographic data. The data already lived in his Facebook Business account. At the time, Facebook Messenger policies were changing and Don had to find a new way to connect with customers. Using this new geographic data, he was able to create a new marketing channel for his food cart and drive more revenue for the small business.
Data wrangling tips:
Think like Nike and Just Do It! Spend time each week looking at your business’s analytics to understand the health of the business, and where you can improve whether it be in customer acquisition, expenses, or paid ads. When you own your business intelligence data, you can make better decisions and make more profit.
2. Most small businesses don’t have the right reporting tools in place.
To say there are a hundred different free reporting tools may be an understatement. Yes, you can use spreadsheets to manage your business data — but they often lead to human error, less informed insights, and can limit what data you act on.
Tools tips:
- Update your toolkit. Any new business should set aside a budget to track and measure their data.
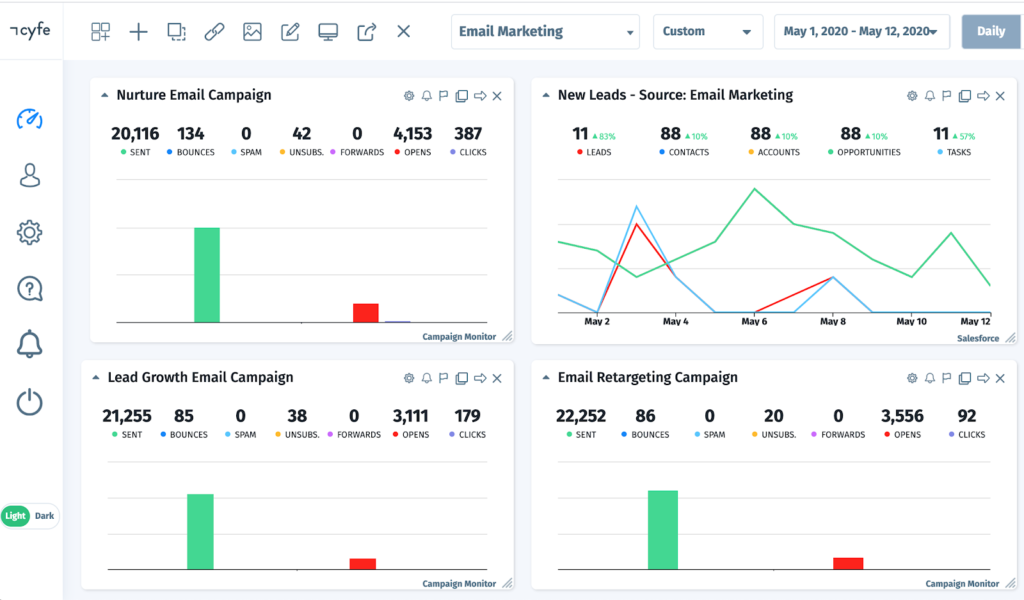
- Choose free reporting tools. Spreadsheets are free. But so is a Cyfe dashboard. You can link up to any data source from finance to sales and marketing softwares, and create a dashboard in minutes.
3. You’re looking at the wrong metrics
Whether you’re a start up, local business, or e-commerce store owner, it’s critical that you identify, track, and improve the right metrics. If you do, you’ll get a clear picture of when you’re adding value to your business and when you’re not.
More often than not, small business analytics focuses on vanity metrics: Facebook Likes or Instagram followers. This extends outside of social media. You could consider revenue a vanity metric if it’s not matched up against how much the company loses. A vanity metric will only tell you half the story.
Metrics tips:
- Set key performance indicators that are easy to understand and access. You can pull data from your Google Analytics or sales system. More on what to track later in this article.
- Track metrics that lead to insights. Social following doesn’t help you understand how good your onboarding is, or how to personalize the customer experience.
- Don’t track totals. For example, total revenue. To see the full picture, you should measure things like customer engagement, percentage of conversions, customer satisfaction, etc.
4. You’ve stopped asking why.
Data doesn’t live in a vacuum. Metrics are usually dependent on each other, for example, say your email click-through rates were up last month, and so we’re your profits. You could report the reason profits were up was because you ran a great email marketing campaign. If that’s the case, you should continue to improve on your email marketing efforts.
Take the extra steps to question your data. To properly validate your claim, you want to support it with a story that explains the how and why behind your success.
6 small business data analytics best practices
Now that we’ve covered the common issues most small business owners face, let’s get into what small business analytics metrics you should track to improve performance.
1. Pay attention to trends
A trend quantifies and explains data patterns over time. It can be an upward or downwards shift in your data set overtime. The goal is to predict what might happen to your business in the future. Armed with this knowledge you can take actions to support good trends and fix bad ones.
You can track trends day-by-day, week-by-week, monthly or quarterly. Whatever time frame works best for your business. Since trends are formed over time, you’ll have to set up your analytics first, wait within the given time period, then compare over time.
Top trends to focus on for small businesses:
- Traffic source: A traffic source report shows you an overview of where people came from before landing on your website. It’s commonly found in your Google Analytics account. For example, a “direct source” would be someone who visited your site by typing in your URL. An “organic source” is Google or another search engine. You want to track traffic sources so you can optimize the channels bringing you the most traffic over time.
- Keyword rankings: To know how people are finding you in search engines, you should track keyword rankings. You can then tell what content is performing well, and if you should improve it or not. Plus what topics you should create content on.
- Customer lifetime value (CLTV): Customer lifetime value is a prediction of the net profit attributed to the relationship of your average customer. You can break these up into segments depending on how many different customer groups you have. Knowing CLTV can help your business focus on acquiring the most profitable and best fit customers for your business.
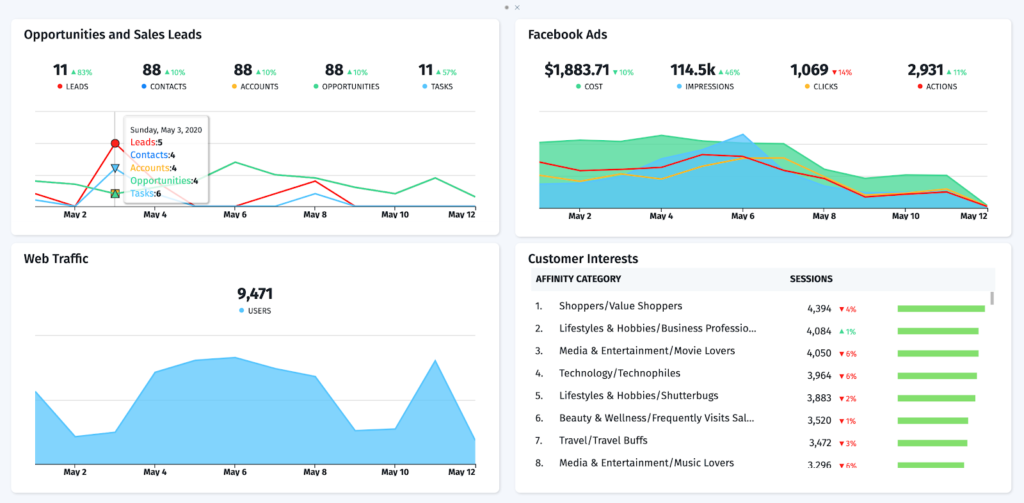
2. Monitor more than just website traffic
Website traffic refers to people who visit your website. It’s measured in visits, or sessions, and is a standard way to measure how good you are at attracting leads. But just measuring website traffic isn’t the only thing you want to measure as a small business. You also want to look at:
- How long people stay on your site. It doesn’t matter how much traffic you have if no one stays for more than a few seconds. Look at bounce rate and time on page to determine how people interact with your site.
- What percentage of visitors convert. Whether you’re an e-commerce business or brick-n-mortar, you have a goal for site visitors. It can be buying a product, signing up for a mailing list, grabbing a coupon. You want to track how many people convert on your website. This will help you determine if your messaging or product offering is effective or not.
Identifying the metrics above, along with demographic data in Google Analytics, can help you figure out who’s actually visiting your site. You could then create better offers, adjust your marketing tactics, and improve your website for conversions. The possibilities are endless once you have good data in place.
3. Oversee cost of customer acquisition
Do you know how much it costs to get a new customer?
The cost of customer acquisition (CAC) is determined by dividing all the costs spent on getting a new customer by the number of new ones in a period of time. For example, if you spent $1,500 on marketing in January and acquired 10 new customers, your CAC is $150.
Remember customer lifetime value (CLTV) from above? Well, say your CLTV is $1,100 and you spend $150 to acquire one, that’s a win for your business.
When you evaluate CAC and CLTV of different customer groups, you can see who your most profitable customers are. Now you can focus on the most rewarding ones rather than customers who cut into your profits.
4. Use data to monitor content engagement
Content is a great way to drive new business. The goal is to draw people to your company by offering tips and insights on issues they care most about. You attract an audience, then convert them into customers over time.
Just like any other form of marketing, you want to measure your content engagement to see how effective it is. Here are a few examples of content engagement metrics to track for your small business:
- Sign-ups: Chances are you’re using content to drive people in from search or social. When someone visits your page, you want to give them the option to sign up for a subscriber list. Today that list can be e-mail, Messenger, or SMS. You can embed a sign-up form directly on your site with a call-to-action that explains why they should join your list.
- Click-through rates (CTR): When you send a message to your list, you want to know how many people act on it. Measuring click-through rates can tell you what type of content works for your audience, and which don’t. The higher the CTR, the better.
- Social shares: Fewer metrics can express your content’s strength than people sharing it with their network on social media. This is different than social engagement, for example, likes and comments. Look at how many people re-posted your content on their feed.
Monitor those trends and which pieces of content or pages are performing best and worst to help you understand what is most impactful and which content to avoid.
5. Keep track of financials
Financials are the painful necessity of small businesses. Some find it boring, while others enjoy the pain. While we recommend working with an accountant to support your financial health, some financial metrics you can track are:
- Income: Without any revenue or income, you don’t have a business. You can’t buy supplies, or pay your team. Track income on a daily, weekly, monthly, quarterly, and yearly basis. And compare it to how you were doing the last period. It’s an easy number to track, think, what are your total sales?
- Expenses: You want to know what it costs to operate your business. If your expenses are too high and income too low, you won’t be in business very long. Expenses can include any tools, softwares, ad spend, employee, etc that cuts into revenue. It’s how you determine if you are profitable or not.
- Cash flow: Negative cash flow plagues many small businesses. You can’t just have money in your business checking account, you need to have a positive cash flow. The ideal cash flow is 2:1 assets to liabilities. If you’re below 1:1, it means you don’t have enough money to operate.
- Aging accounts receivable: An aging accounts receivable can be shocking for businesses who invoice customers. It reports on unpaid customer invoices and is used to identify cash flow problems. For example, if one customer pays in 30 days, but 3 other clients pay over 90 to 120 days, you’ll have a cash flow problem. You now know to charge late payment fees or drop clients who don’t pay on time.
6. Make your data accessible
If your data is not accessible and easy to find, you won’t get much insight from it. Here are some guidelines to make your data easier to understand and present.
- Present your business analytics on mobile. With teams becoming more dispersed, make sure data is accessible by everyone, at any time — whether it’s in a meeting, on a plane, or on the beach.
- Make data easy to share. All your data should live in one place. That way you can share insights with teams, clients, or vendors via link or click of button. This includes simple export features so you can save and store specific files over time.
- Invest in real-time monitoring. A good data dashboard will give viewers live updates of your most important metrics. Whether it be website traffic, online sales, or active sales funnels.
- Auto-send reports to stakeholders. Some people don’t want to log into an analytics dashboard — and that’s okay. With Cyfe, you can create reports based on specific information and set a time to send them to yourself and other team members.
Making the most of your business intelligence as a small business
Now that you have some insight into managing small business analytics, the ball is in your court. Taking control of your data can benefit your business long into the future — and help drive more revenue. From there, you can really dive into business intelligence and take your business to the next level.